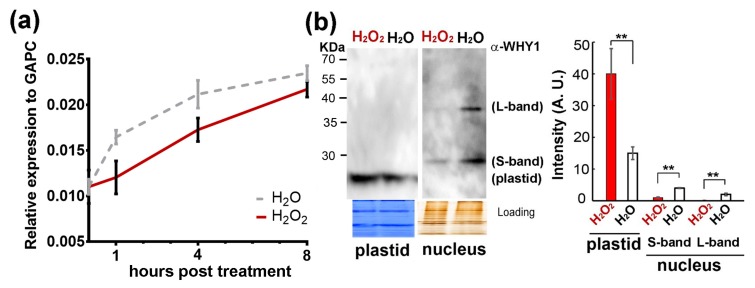
Figure 6.
Effects of exogenous H2O2 treatments on transcript levels and protein subcellular distributions of WHY1 in 5-week-old WT plants. (a) Relative gene expression levels in plants sprayed with 0.3% H2O2. Error bars represent the SD of three biological replicates. No significant differences were detected using a multiple t-test by the two-stage linear step-up procedure of Benjamini et al. in GraphPad Prism (version 7.1); (b) Organelle isoforms of WHY1 proteins in WT plants receiving H2O2 or H2O treatment. Left, a representative protein immunodetection of purified plastid and nuclear fractions at 4 h post-treatment. The purity of nuclear and plastid proteins without cross-contamination was monitored using antibodies against histone 3 or photosystem II (PSII) protein (Supplementary Figure S5). Coomassie and silver staining were used as loading controls, and the western blot was detected using an anti-WHY1 antibody. Right, quantitative measurement of protein band intensity using Image J software (see Materials and Methods for details). Values were means of three independent experiments. Statistical significance was analyzed using a paired Student’s t-test. **p < 0.01.

