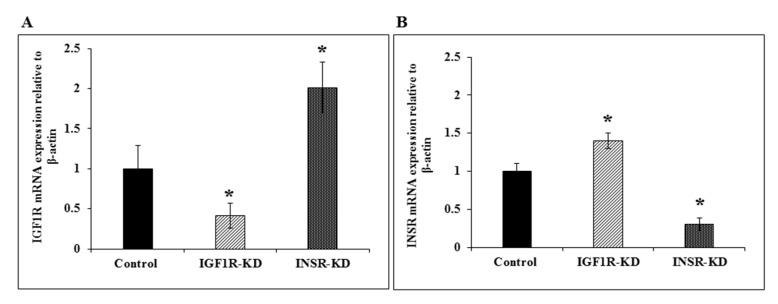
Figure 3.
Real time-quantitative PCR analysis of IGF1R and INSR mRNA levels. Confluent MCF7-derived IGF1R-KD, INSR-KD and control cells were harvested and total RNA was prepared, as described in Section 2. Levels of IGF1R (A) and INSR (B) mRNAs were measured by RT-QPCR using primers described in Table 1. For each mRNA, a value of 1 was given to the level displayed by controls. Bars denote mean ± SEM (n = 3). *, p < 0.05 versus respective control.

