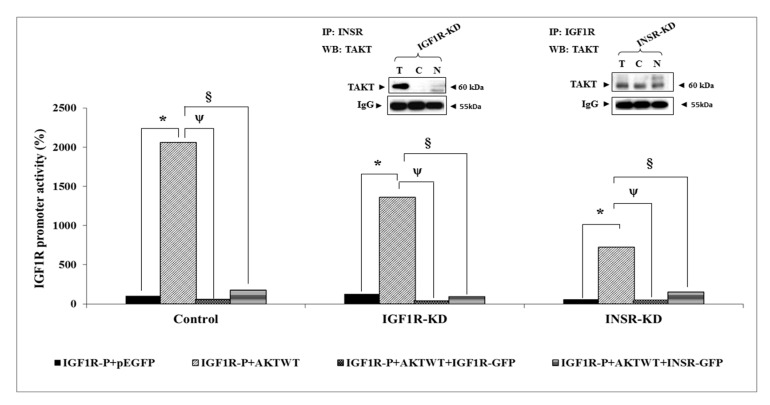
Figure 6.
Effect of AKT on IGF1R promoter activity. IGF1R-KD, INSR-KD and control MCF7 cells were co-transfected with the p(−476/+640)LUC IGF1R promoter along with a wild-type AKT expression vector (dotted bars), or empty GFP vector (solid bars). In addition, transfection mix included an IGF1R-GFP expression vector (circles-filled bars) or an INSR-GFP expression vector (horizontally hatched bars). After 48 h, cells were harvested and luciferase activity was measured. Promoter activities are expressed as luciferase values normalized to total protein. A value of 100% was given to the promoter activity generated by the reporter plasmid in control MCF7 cells. *, p < 0.01 AKTWT-co-transfected cells versus empty vector co-transfected cells; ψ, p < 0.01 AKTWT + IGF1R-GFP-co-transfected cells versus empty vector co-transfected cells; §, p < 0.01 AKTWT + INSR-GFP-co-transfected cells versus empty vector co-transfected cells. Total, cytoplasmic and nuclear fractions of IGF1R-KD and INSR-KD cells were immunoprecipitated with anti-INSR or anti-IGF1R, respectively, and immunoblotted with an AKT antibody (insets). The 60-kDa total AKT band is indicated. IgG was used as a control for the co-IP experiment. All experiments were conducted in triplicates.

