Figure 5.
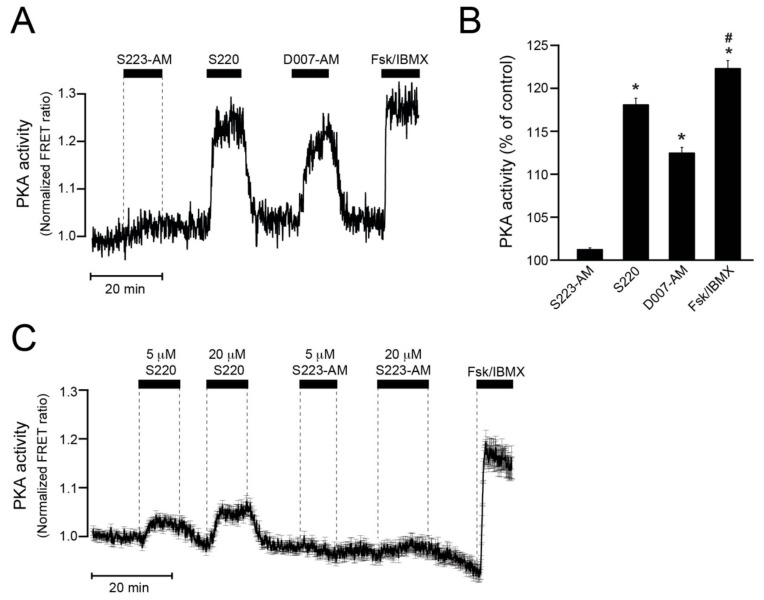
Recordings of PKA activity in MIN6 β-cells. (A) Representative single-cell time-lapse recording of PKA activity using TIRF microscopy and the PM-AKAR3 reporter. The cell was sequentially exposed to S223AM (5 µM), S220 (100 µM), 007AM (5 µM), and the combination of forskolin (10 µM) and IBMX (100 µM) added to the superfusion medium in the presence of a sub-stimulatory glucose concentration (3 mM). Increased PKA activity results in increased intramolecular FRET recorded as sensitized emission and expressed as normalized FRET ratio. (B) Means ± s.e.m. for the time-average FRET ratios during exposure to the different drugs normalized to control. N = 75 cells from three experiments with three different cell preparations. * p < 0.001 for difference from S223-AM; # p < 0.001 for difference from D007-AM and S220 (Student’s t-test). (C) Average ± s.e.m. of 78 single-cell FRET ratio traces from two recordings of PKA activity in MIN6 cells exposed to 5 and 20 µM of S220 and S223-AM as well as the combination of 10 µM forskolin and 100 µM IBMX.

