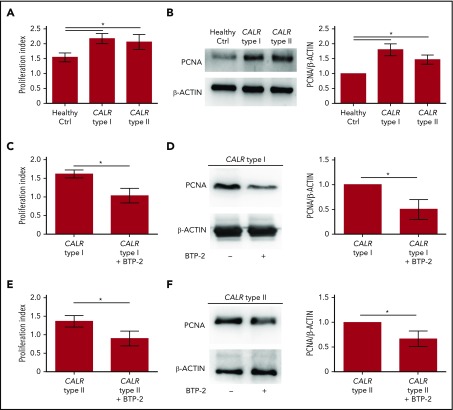
Figure 6.
Proliferation of CALR type I Mks is counteracted by SOCE inhibition. (A) Cell proliferation assay of Mk culture from healthy controls (Ctrl) and CALR type I and type II patients (n = 8 per subgroup; P < .05). (B) Representative western blot analysis of PCNA expression in mature Mks from healthy control (ctrl) and CALR type I and type II patients. β-ACTIN was used to ensure equal loading. The band densitometry analysis of 3 independent experiments is shown (P < .05). (C) Cell proliferation assay of cytokine-starved CALR type I Mks in presence or not of the SOCE inhibitor BTP-2 (20 μM) (n = 3; P < .05). (D) Western blot analysis of PCNA expression in cytokine-starved CALR type I Mks cultured in absence (−) or presence (+) of 20 µM BTP-2. β-ACTIN serves as loading control. The band densitometry analysis of 3 independent experiments is shown (P < .05). (E) Cell proliferation assay of cytokine-starved CALR type II Mks in presence or not of BTP-2 (20 μM) (n = 3; P < .05). (F) Western blot analysis of PCNA expression in cytokine-starved CALR type II Mks cultured in absence (−) or presence (+) of 20 µM BTP-2. β-ACTIN serves as loading control. The band densitometry analysis of 3 independent experiments is shown (P < .05).

