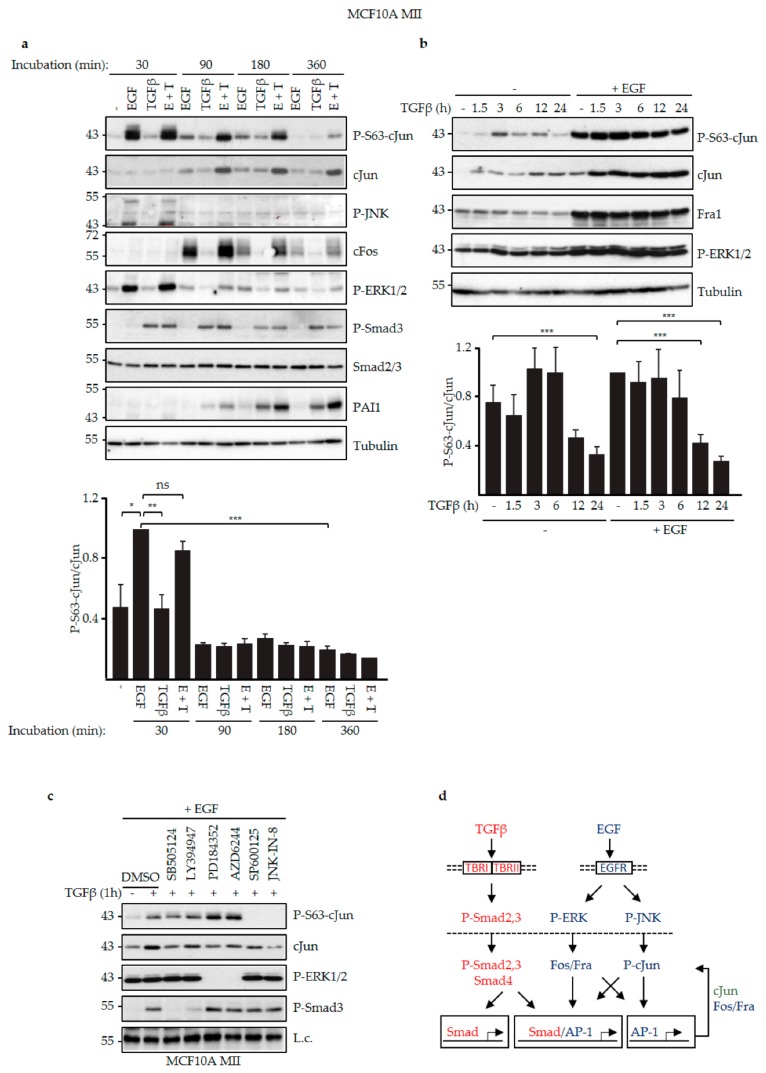
Figure 3.
EGF and TGFβ differentially induced phospho-cJun activity. (a) MCF10A MII cells were incubated for 24 h in serum-starvation medium (insulin, cholera toxin, hydrocortisone, 0.2% FBS) without EGF, subsequently treated with 20 ng/mL EGF and/or 5 ng/mL TGFβ for the indicated time periods, and then analyzed by immunoblotting for P-S63-cJun, cJun, P-JNK, cFos, P-ERK1/2, P-Smad3, Smad2/3, and PAI1. Tubulin was included as loading control; a representative experiment is shown. The levels of P-S63-cJun and (total) cJun of three independent biological replicates were quantified by densitometry to determine the effects of EGF and TGFβ on the relative ratio of the levels of P-S63-cJun and cJun in time, depicted in the graph. For proper comparison of the data of the different experiments, the ratio of the levels of P-S63-cJun and cJun at the 30 min EGF time point of each experiment was set at 1.0. (b) MCF10A MII cells were incubated for 24 h in EGF-containing serum-starvation medium (EGF, insulin, cholera toxin, hydrocortisone, 0.2% FBS) or in starvation medium lacking EGF as indicated, treated with 5 ng/mL TGFβ for the indicated time periods, and analyzed by immunoblotting for P-S63-cJun, cJun, Fra1, and P-ERK1/2. Tubulin was included as loading control; a representative experiment is shown. The levels of P-S63-cJun and (total) cJun of four independent biological replicates were quantified to determine the effects of EGF and/or TGFβ on the relative ratio of the levels of P-S63-cJun and cJun in time, depicted in the graph. For proper comparison of the data of the different experiments, the ratio of the levels of P-S63-cJun and cJun at the 0 h TGFβ + EGF time point of each experiment was set at 1.0. *p < 0.05, **p < 0.01, ***p < 0.001 (c) MCF10A MII cells were incubated for 24 h in EGF-containing serum-starvation medium, subsequently stimulated for 1 h with TGFβ in the presence or absence of the indicated TGFβRI, MEK, and JNK inhibitors, and analyzed by immunoblotting for P-S63-cJun, cJun, P-ERK1/2, and P-Smad3. The inhibitors were added 30 min before TGFβ. A background band was included as loading control (L.c.); (d) Schematic model to explain the data in panels (a–c) in view of the current literature. EGF signaling via cell-membrane-localized EGFR triggers phosphorylation and activation of ERK and JNK, which in the nucleus activate and induce FOS family members and phosphorylation of cJun, respectively, which subsequently can auto-regulate their own expression via AP-1 sites [22,26]. TGFβ signaling via membrane-localized TBRI and TBRII triggers phosphorylation and activation of Smad2 and 3, and thereby can both directly and indirectly induce TGFβ target genes controlled by Smad and/or AP-1 sites [1,2].

