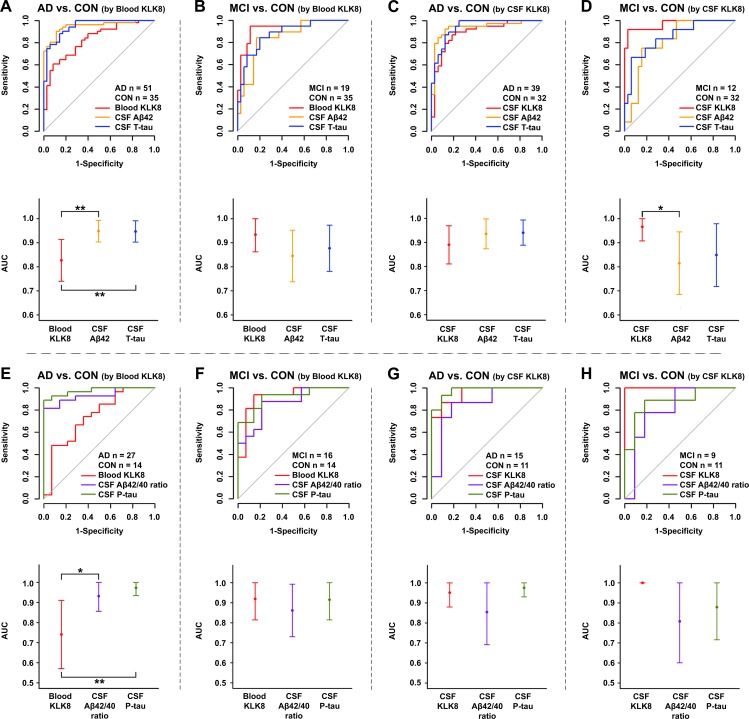
Figure 4.
Diagnostic performance of KLK8 in comparison to CSF AD biomarkers ROC analyses (upper panel) and AUC plots (lower panel) of CSF T-tau and CSF Aβ42 (A–D) or CSF P-tau and CSF Aβ42/Aβ40 ratio (E–H) in comparison to KLK8 in blood (A, B, E, F) and CSF (C, D, G, H). A and C show the performances of blood (A) and CSF (C) KLK8 as well as that of CSF T-tau and CSF Aβ42 in distinguishing AD from controls; the performances for discrimination of MCI and control are represented in B and D. The performances of blood (E) and CSF (G) KLK8 for discriminating AD from controls in comparison to CSF P-tau and CSF Aβ42/Aβ40 are shown in E and G, while the performances for distinguishing MCI from controls are represented in F and H. Data were adjusted for gender, age and study group. Point estimates in the lower panel represent AUCs and the error bars each 95% CI. P values were determined by DeLong test. For the sake of better comparability with other biomarkers ROC curves for CSF Aβ42 and CSF Aβ42/40 are depicted as ‘-CSF Aβ42’ and ‘-CSF Aβ42/40’. *P≤0.04; **p≤0.007. AD, Alzheimer’s disease; AUC, area under the curve; Aβ42 or 40, β-amyloid 42 or 40; CON, controls; CSF, cerebrospinal fluid; MCI, mild cognitive impairment due to AD; P-tau, phosphorylated tau; ROC, receiver operating characteristic; T-tau, total tau.

