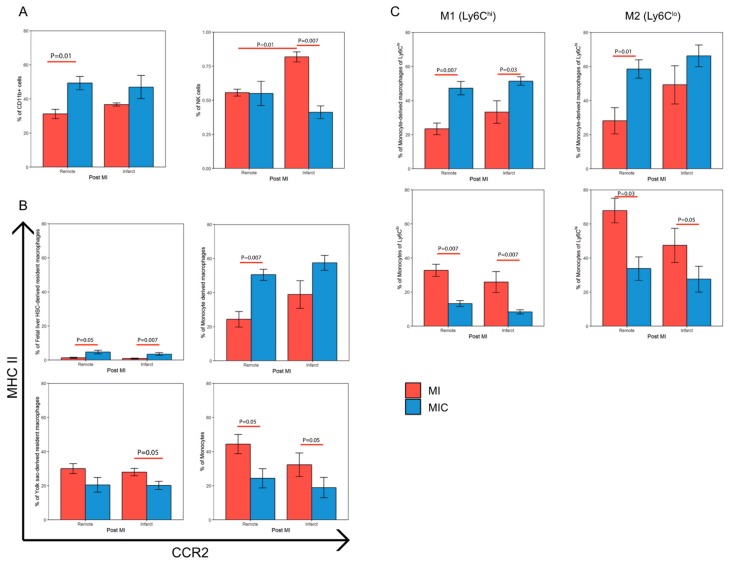
Figure 11.
Effect of CiC transplantation on the percentage of various immune cell subpopulations in the heart based on flow cytometric analysis. Mice were subjected to MI/MI+ cells and the remote and infarct area of the hearts were dissected, digested, and the isolated mononuclear cells were stained using various antibodies. These immune cell populations were then characterized using the gating strategy described before and represented as three major groups. (A) CD11b+ and NK cells, (B) populations based on their CCR2/MHC-II expression, and (C) contribution of the populations towards the M1 (Ly6Chi) and M2 (Ly6Clo) cells, n = 5. Values are represented as mean ± SEM. Significance was calculated using the Mann–Whitney test.

