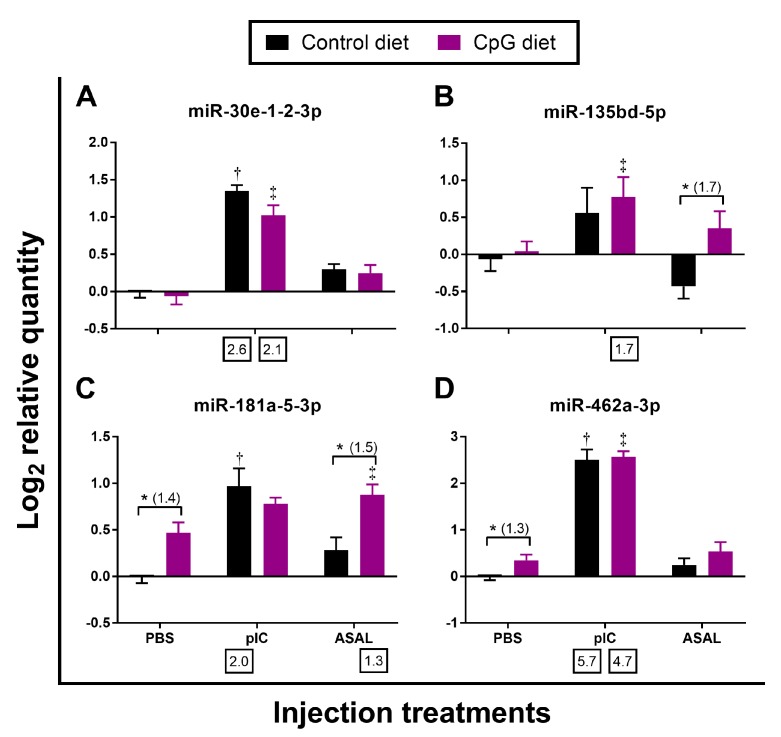
Figure 3.
qPCR analyses of miRNAs identified by deep sequencing as being responsive to pIC alone (n = 8–9). Average log2 RQs with SE bars are plotted. An asterisk (*) represents a significant difference between diets in each injection treatment (p < 0.05) with fold-change given in brackets. A dagger (†) or diesis (‡) represents a significant difference between the pIC/ASAL-injected salmon and the diet-matched PBS-injected control (p < 0.05) with fold-change indicated below the x-axis. For qPCR fold-change calculation, overall fold up-regulation was calculated as 2A−B as in Xue et al. [46], where A is the mean of log2 RQ from the pIC or ASAL groups, and B is the mean of log2 RQ from the diet-matched PBS group. (A) miR-30e-1-2-3p; (B) miR-135bd-5p; (C) miR-181a-5-3p; (D) miR-462a-3p.

