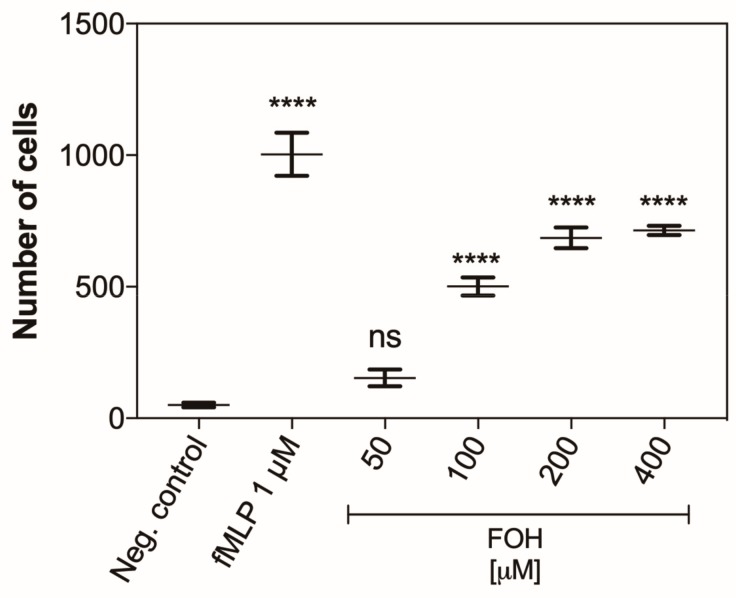
Figure 10.
Chemotactic activity of FOH-treated neutrophils. CellTracker Red labeled neutrophil cells (1 × 10⁶ cells/well) were placed into chemotaxis chambers being in contact with different concentration of FOH or 1 µM fML (a positive control). Negative control was PBS. After 1 h of incubation, the chambers were removed, and migrated cells were counted. Data represent the mean number of cells ± S.E.M. from three replicates. ANOVA and Dunnett’s multiple comparisons post-tests were used. Asterisks denote statistical significance (p > 0.1234 ns, **** p < 0.0001).

