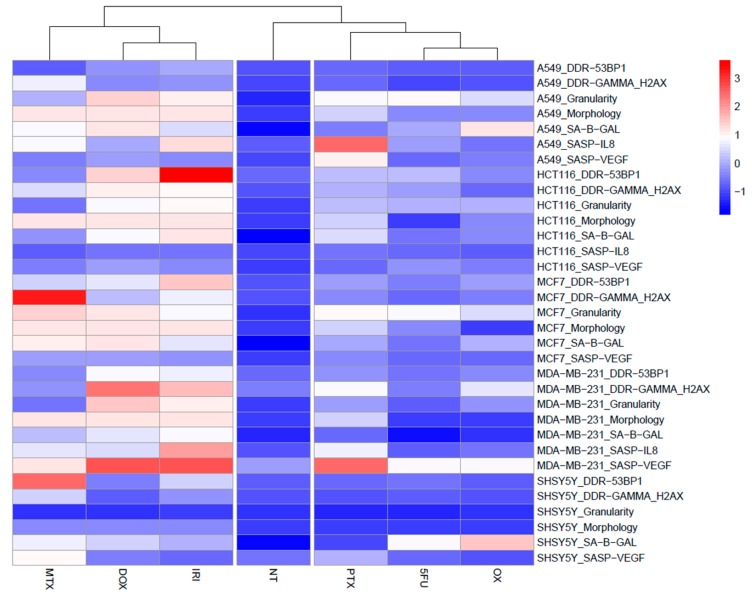
Figure 7.
Heatmap showing characteristic features of senescence: senescence morphology (cell size), number of cells with elevated SA-β-gal activity, SASP production, and DDR activation (activation of DDR signaling and number of DNA damage foci) after MTX, DOX, and IRI treatment. Original data points standarized into z-scores. NT: nontreated cells.

