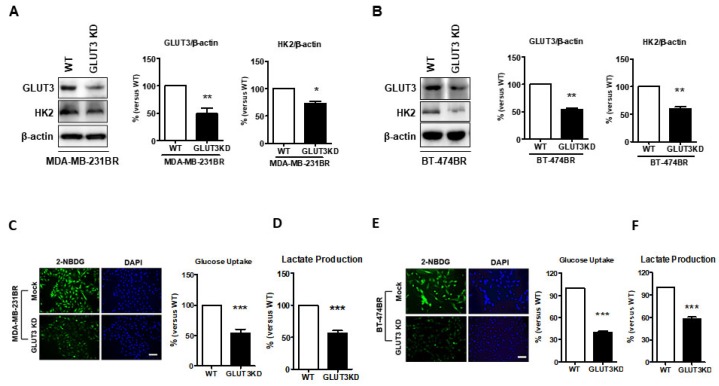
Figure 3.
Altered glucose metabolism in GLUT3 knockdown MDA-MB-231 and BT474 brain metastatic cells; (A,B) Western blots showing the GLUT3 knockdown and reduced HK2 expression. The histograms show quantification of respective western blots. (C,E) Glucose uptake was assessed by 2-NBDG treatment that was imaged and quantified as in Figure 2B,D. (D,F) Histograms show quantification of lactate production that was detected by fluorescence microscopy. Data are expressed as mean ± SEM from three to five independent experiments. * p < 0.05; ** p < 0.01; *** p < 0.001; scale bar = 50 μm.

