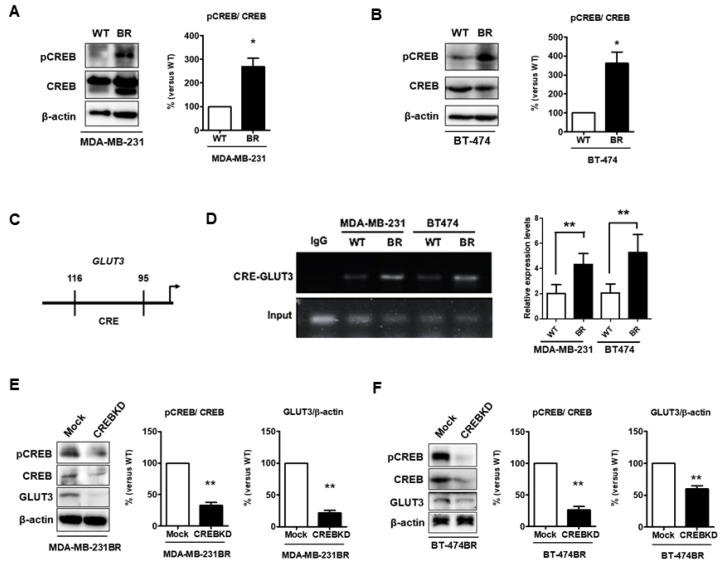
Figure 8.
Levels of pCREB are increased and CREB mediates GLUT3 expression in breast cancer brain metastatic cells; (A,B) pCREB and CREB expression determined by Western blotting in both MDA-MB-231 and BT474 cells, and histograms showing quantification of respective western blots. (C) The schematic CREB binding region in GLUT3 promoter. (D) The CREB binding with GLUT3 promoter DNA was assessed by RT-PCR. The histogram shows quantification of RT-PCR data. (E,F) the CREB knockdown validation and GLUT3 reduction were analyzed by Western blotting. The histograms show quantification of each protein in respective western blots. Data are expressed as mean ± SEM from three to five independent experiments and mice. * p < 0.05; ** p < 0.01.

