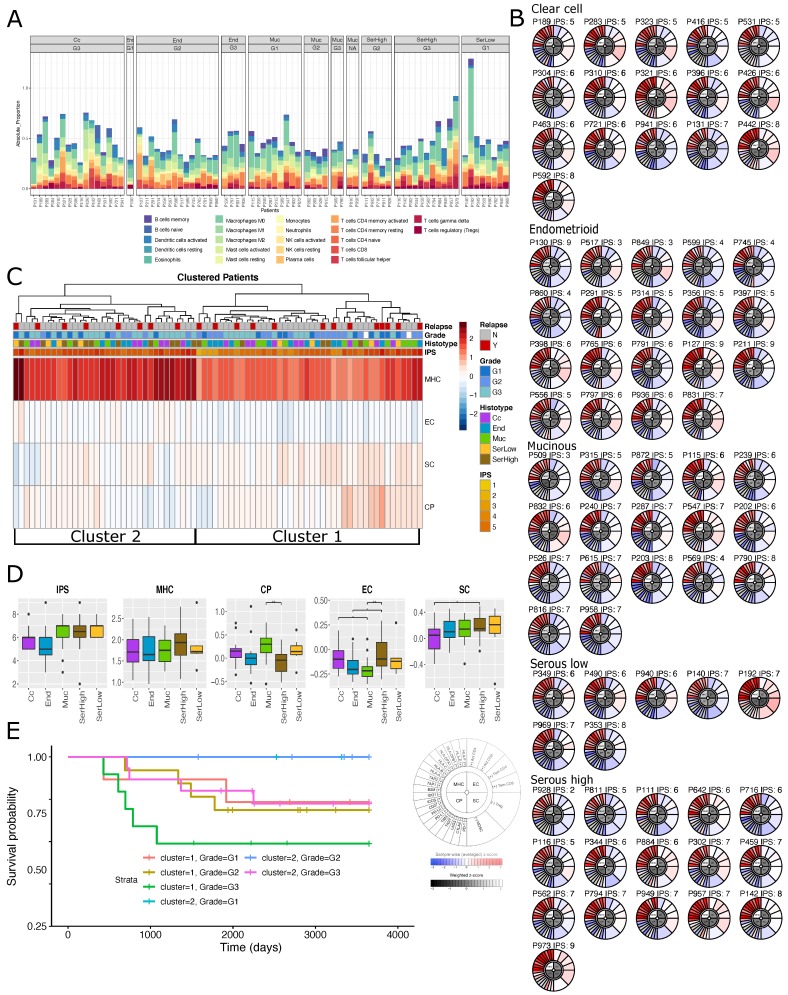
Figure 2.
Immune cell composition and behavior in stage I EOC samples. (A) absolute fractions of immune cell types per sample obtained using a CIBERSORT deconvolution method; (B) patient’s immunophenograms grouped by histotypes and ordered by grade; (C) cluster analysis of patients using major histocompatibility complex (MHC), checkpoints immunomodulators (CP), immune effector cells (EC) and suppressor cells (SC) values along with histo-pathological annotations and immunophenoscores (IPS). (D) box-plots of IPS along with its four components (MHC, CP, SC and EC) across histotypes and tumor grades. Sample sizes for each boxplot is . (E) Kaplan–Meier survival curves of patients grouped according to cluster 1 and 2 (see panel c) stratified by grade.

