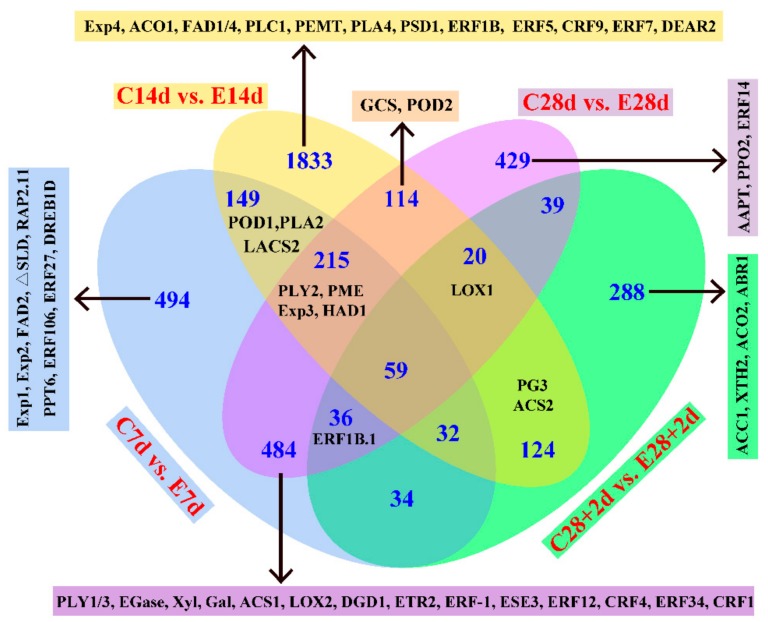
Figure 3.
Venn diagrams illustrating the number of differentially expressed genes (DEGs) revealed by paired comparison between ethylene treated and control peach fruit. AAPT, aminoalcoholphosphotransferase; ACO, 1-aminocyclopropane-1-carboxylic acid (ACC) oxidase; ACS, ACC synthase; EGase, β-1, 4-endoglucanase; ETR, ethylene receptor; Exp, Expansin; FAD, fatty acid desaturase; Gal, galactosidase; GCS, glucosylceramide synthase; LACS, long-chain acyl-CoA synthetase; LOX, lipoxygenase; PG, polygalacturonase; PLC, phospholipase C; PLY, pectate lyase; PME, pectin methylesterase; POD, peroxidase; PPO, polyphenol oxidase; Xyl, xylosidase; XTH, xyloglucan endo-transglucosylase/hydrolase. The sampling points beginning with letter C or E indicate those belong to control and ethylene treatments, respectively.

