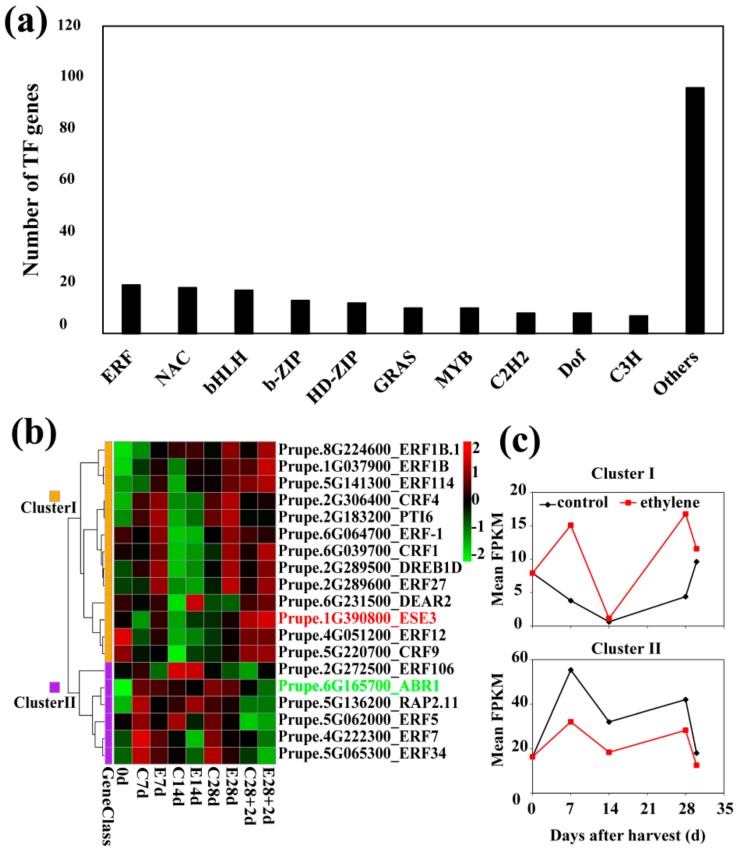
Figure 10.
Transcription factors differentially expressed in control and ethylene fruit. (a) The number of differentially expressed transcription factors from different classes. (b) Expression profiles (log2 FPKM) of differentially expressed ERF family members. Red letter indicates gene transcript level was significantly up-regulated on shelf; green letter indicate gene transcript level was significantly induced by low temperature storage. (c) Representative expression patterns of mean FPKM value of genes in two clusters from hierarchy cluster analysis in (b). ABR, abscisic acid repressor; CRF, cytokinin response factor; DEAR, DERB and EAR motif protein; DREB, dehydration responsive element binding factor; ERF, ethylene response factor; FPKM, fragments per kilobase of exon per million reads mapped; PTI, pathogenesis-related genes transcriptional activator. The sampling points beginning with the letter C or E indicate those belong to control and ethylene treatments, respectively. The two ERF members with IDs and names in red or green are those further described in detail in the following analyses.

