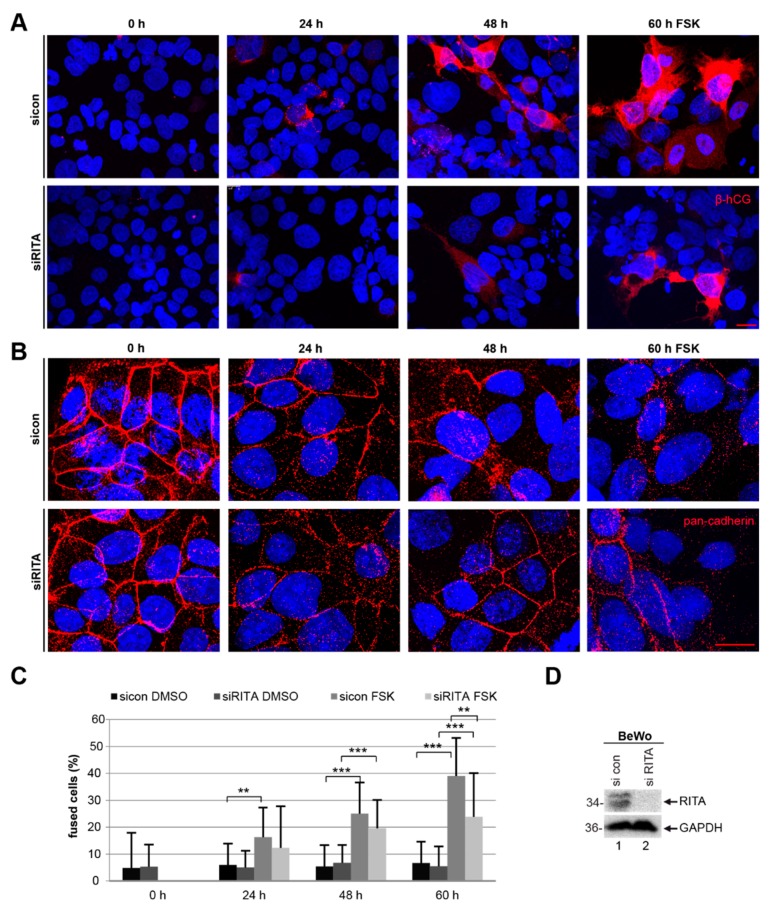
Figure 6.
Suppression of RITA impairs the fusion rate of BeWo cells. BeWo cells were treated with control siRNA (sicon) or siRNA targeting RITA (siRITA) for 24 h and additionally with forskolin (FSK) or DMSO for indicated time periods. (A) Treated BeWo cells were fixated and stained for the fusion marker β-hCG (red) and DNA (DAPI, blue). Examples are shown. Scale: 25 µm. (B) The treated BeWo cells were stained for pan-cadherin (red) and DNA (DAPI, blue). Representative images are shown. Scale: 25 µm. (C) For microscopic evaluation and quantification of fused cells, the pan-cadherin (red) and DNA (DAPI, blue) staining were used. The results are displayed in percentages at indicated time periods. The results are shown as mean ± standard deviation (SD). Student’s t-test, ** p < 0.01, *** p < 0.001. (D) Western blot analysis using antibodies against RITA and GAPDH. GAPDH served as loading control.

