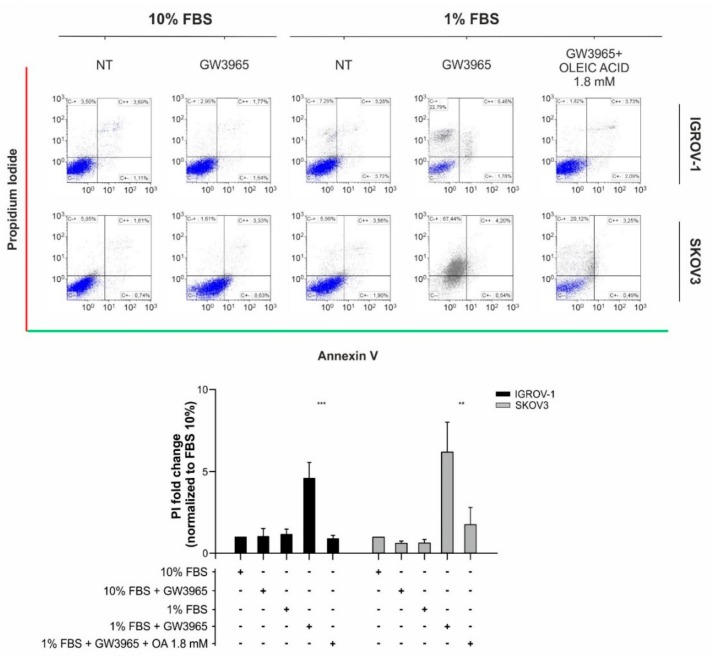
Figure 6.
GW3965 effect on IGROV-1 and SKOV3 ovarian cancer cell death. Apoptosis/necrosis evaluation in cancer cells following GW3965 treatment at IC50 concentrations and under serum starvation (1% FBS) with supplementation of oleic acid (1.8 mM). Top panel: representative dot blots of cell populations with the X-axis for Annexin V positivity and the Y-axis for propidium iodide (PI) positivity. Bottom panel: Quantitative evaluation of necrosis. Data are normalized to PI positivity cells percentage under normal serum condition (10% FBS). Columns report the mean values ± SD of four different replicates for each condition (** p < 0.01, *** p < 0.001, t-test).

