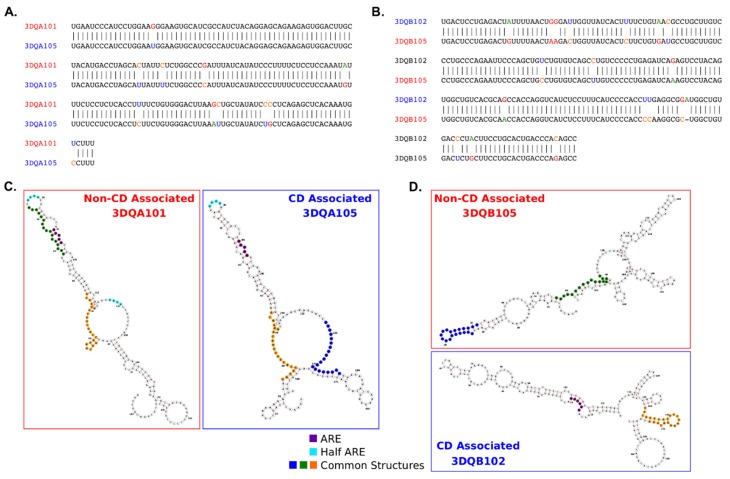
Figure 2.
Sequences and structures comparison between 3′UTR of DQA1* and DQB1* genes. (A) Comparison of the 3′UTR sequences for the DQA1*01 and DQA1*05 alleles indicates 94.1% sequence identity. There is a slightly higher proportion of GC content in the DQA1*01 allele (0.46) as compared to DQA1*05 (0.44). (B) The DQB1*05 and DQB1*02 alleles show a lower sequence identity (92.3%), but identical GC proportions (0.55). (C,D) RNA secondary structure prediction reveals the sequence differences between alleles impacts the minimum-free energy folding (RNAfold). Common structural motifs from FOLDALIGN are mapped onto the structures as well as canonical ARE (AUUUA/AUUUUA) and half-ARE motifs (e.g., UAUU).

