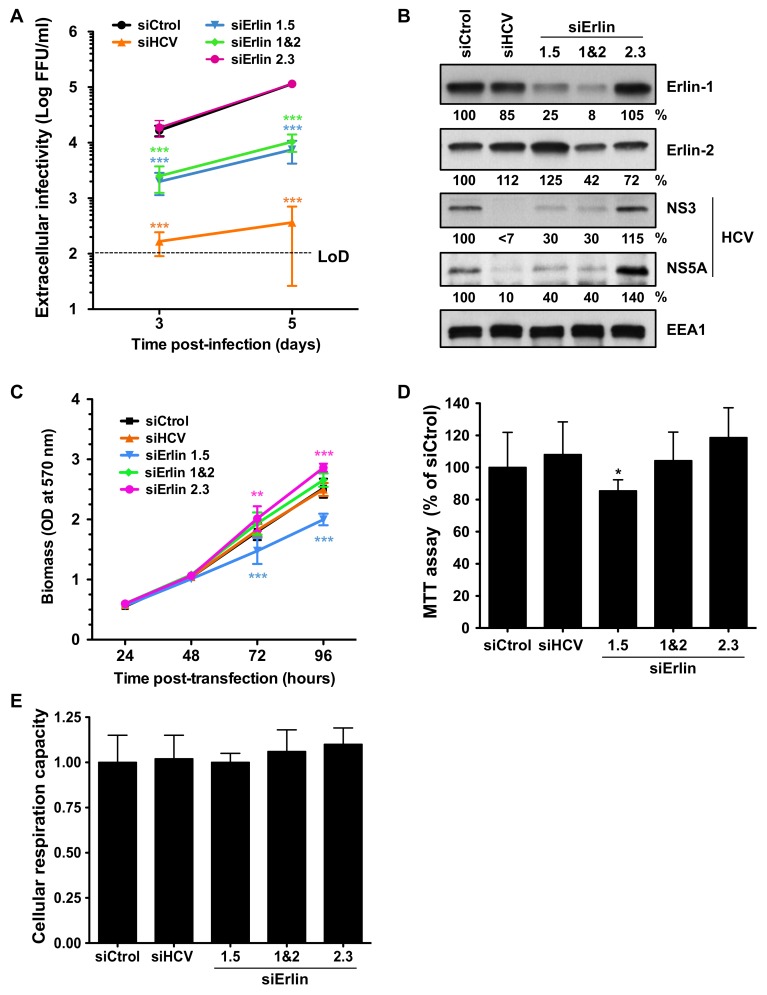
Figure 1.
Erlin-1 protein down-regulation impairs efficient HCV infection. Huh-7 cells were transfected with individual siRNAs targeting erlin-1 (siErlin 1.5), erlin-2 (siErlin 2.3), both erlins simultaneously (siErlin 1&2), HCV (siHCV) or a non-targeting siRNA control (siCtrol) as indicated in Material and Methods section. Transfected cells were infected 36 h later with JFH-1 D183 virus at low multiplicity of infection (moi = 0.2). (A) The extracellular infectivity present in supernatants of infected cells was determined on days three and five post-inoculation by titration assay. Infectivity titers are represented as the FFUs per ml of supernatant in logarithmic scale and are displayed as the average and standard deviation (Mean; SD; n = 3). The horizontal black dotty line represents the limit of detection (LoD) of the assay. (B) Three days after virus inoculation cellular erlin-1, erlin-2 and EEA1 (as loading control) and viral NS3 and NS5A protein expression was determined in HCV-infected cell extracts by WB. Relative protein levels were determined by densitometry and are shown below each panel. The ratio of intensities of each protein and EEA1 in siCtrol-transfected cells was set as 100 and it was used to calculate the relative amount of each protein in each sample. Results in panels A and B are representative of two independent experiments, each one performed in triplicate. (C) Cells plated in 96-well plate format were transfected with siRNAs and the cell biomass was quantitated by crystal violet staining at different times post-transfection. Data are displayed as the average and standard deviation of two independent experiments with three replica wells per condition at each time point in each experiment (Mean; SD; n = 6). (D) Cells plated in 96-well plate format were transfected and infected as described above and were used to perform MTT assays three days after HCV inoculation. Data are displayed as the average and standard deviation (Mean; SD; n = 7) relative to the levels in siCtrol condition, set as 100. Results are representative of two independent experiments with seven replica wells per condition in each experiment. (E) The cellular respiration capacity was calculated as described in Material and Methods section. Data are displayed as the average and standard deviation (Mean; SD; n = 3) relative to that of siCtrol, set as 1. Statistical significance was determined using: Two-way ANOVA followed by a Bonferroni posttest for panels A and C (** p < 0.01; *** p < 0.001), and One-way ANOVA followed by the Dunnett’s Multiple Comparison Test for panels D and E (* p < 0.05).

