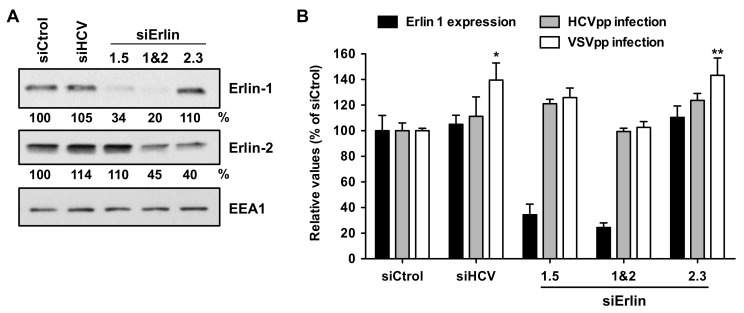
Figure 2.
Erlin-1 protein down-regulation does not inhibit HCV cell-entry. Huh-7 cells were transfected with individual siRNAs as described in Material and Methods. (A) 36 h later one set of wells was harvested for erlin protein analysis by WB. Relative protein expression levels were determined by densitometry as described in the legend of Figure 1 and they are shown below each panel. (B) Another set of wells was inoculated with HCVpp (grey bars) or particles harboring the VSV-G glycoprotein (VSVpp; white bars) as control. 48 h after inoculation the intracellular luciferase activity was measured. Results are displayed as percentage of the luciferase activity present in siCtrol-transfected cell extracts for each virus particle. Data are displayed as the average and standard deviation (Mean; SD; n = 3). The luciferase values (units per well) in siCtrol-transfected cell extracts were 9 × 10³ ± 5.1 × 10² and 1.2 × 10⁴ ± 2 × 10² for HCVpp and VSVpp, respectively. These results are representative of two independent experiments, each one performed in triplicate. The average erlin-1 protein expression level of the two experiments is shown in black bars. One-way ANOVA followed by Dunnett’s Multiple Comparison Test analysis of the HCVpp data did not show any statistically significant effect on the luciferase levels among different siRNAs. Instead, the entry of VSVpp was significantly higher in siHCV- and siErlin 2.3-transfected cells (* p < 0.05; ** p < 0.01).

