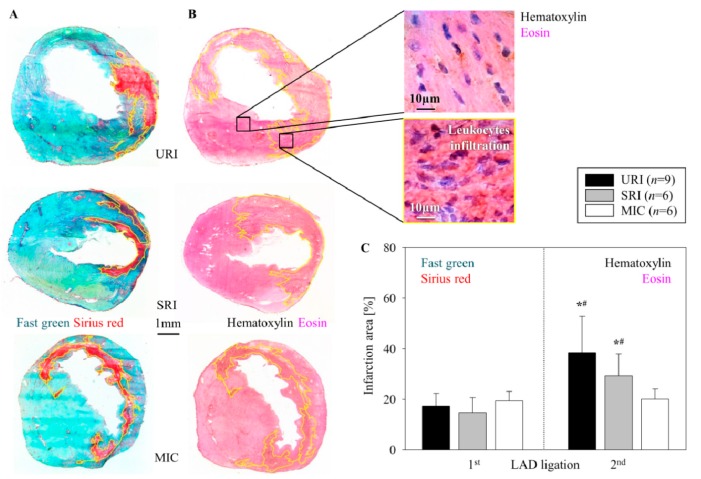
Figure 4.
Alterations in MI size. Representative images show the infarction area (enclosed within the yellow border) for URI, SRI, and MIC 9 days after the first LAD ligation (Fast Green and Sirius Red staining) (A), as well as 48 h after the second LAD ligation (Hematoxylin and Eosin staining) (B). Significant increase of the infarction size after the second LAD ligation, mean ± SD, * p ≤ 0.009 as compared with the first LAD ligation, # p ≤ 0.041 in contrast to MIC (Mann–Whitney U test) (C).

