Figure 1.
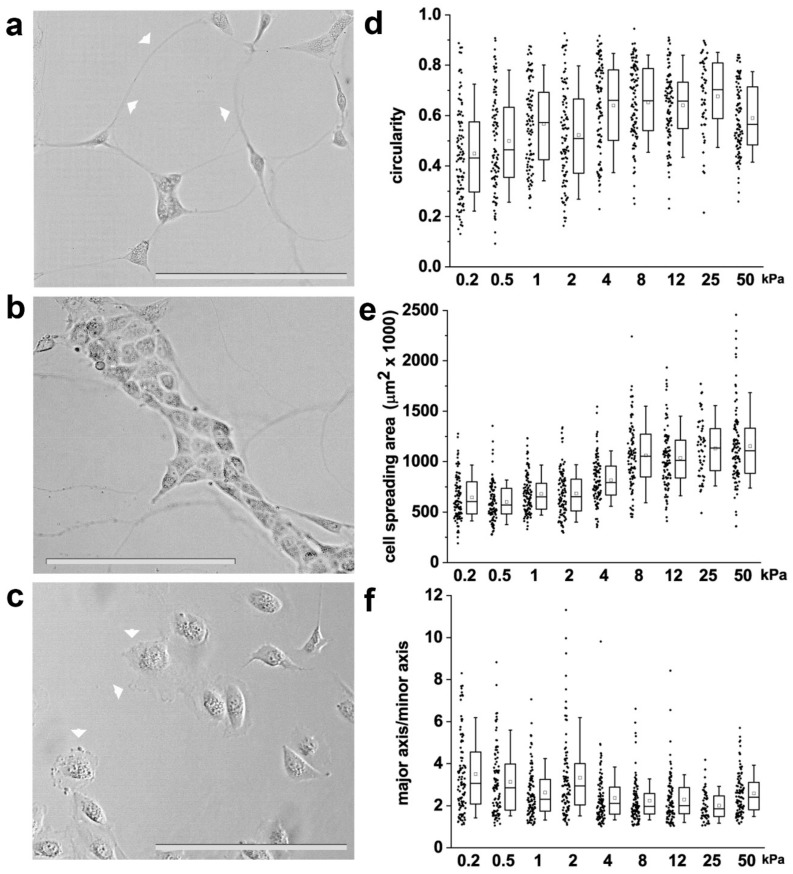
Substrate stiffness affects renal progenitor cell (RPC) morphology in vitro. (a,b) Representative optical phase contrast images of RPCs grown on substrates of 0.5 kPa Young’s modulus. Arrowheads point to long protrusions resembling tunneling nanotubes. (c) Representative optical phase contrast images of RPCs grown on substrate of 50 kPa Young’s modulus. Arrowheads point to sheet-like membrane protrusions resembling lamellipodia. (d) Quantification of single cell circularity, (e) cell area and (f) major to minor axis ratio. At least 70 cells were analyzed from two independent experiments. Box-and-whisker plots: line = median, box = 25–75%, whiskers = 10–90%. Statistical analysis was performed using ANOVA with Tukey post-hoc test. For statistical analysis results, see Table S1 in Supplemental Data. Bars = 200 µm.

