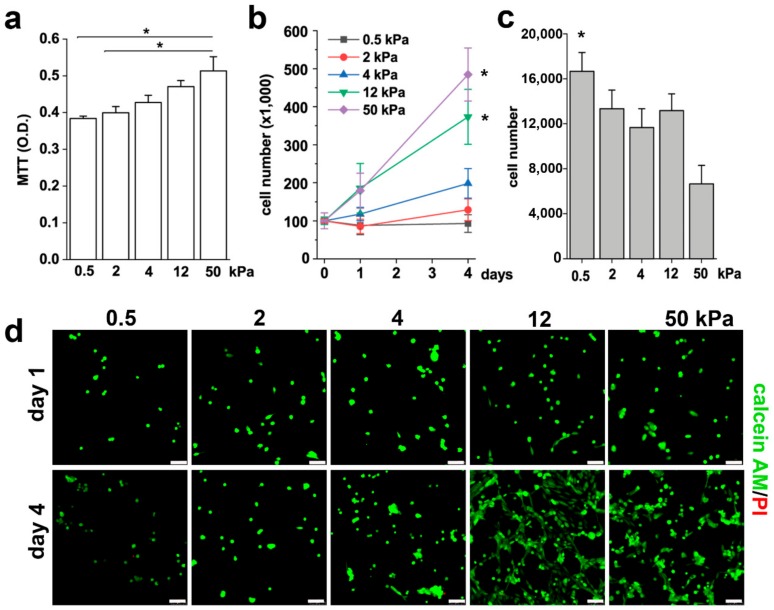
Figure 2.
Substrate stiffness modulates RPC proliferative capacity in vitro. (a) MTT assay of RPCs performed 48 h after plating on substrates with different stiffness. Data are expressed as mean ± SE. (b) Growth curves obtained culturing RPCs for 4 days on substrates of different stiffness. Data are expressed as mean ± SE (replicate n = 6). (c) Number of RPCs present in the surnatant 24 h after plating. Data are expressed as mean ± SE (replicate n = 2). (d) Confocal images of Calcein AM (green fluorescence) and propidium iodide (red) staining in RPCs at day 1 and day 4 after plating. * p < 0.05, using one-way ANOVA with Tukey post-hoc test. Bars = 75 µm.

