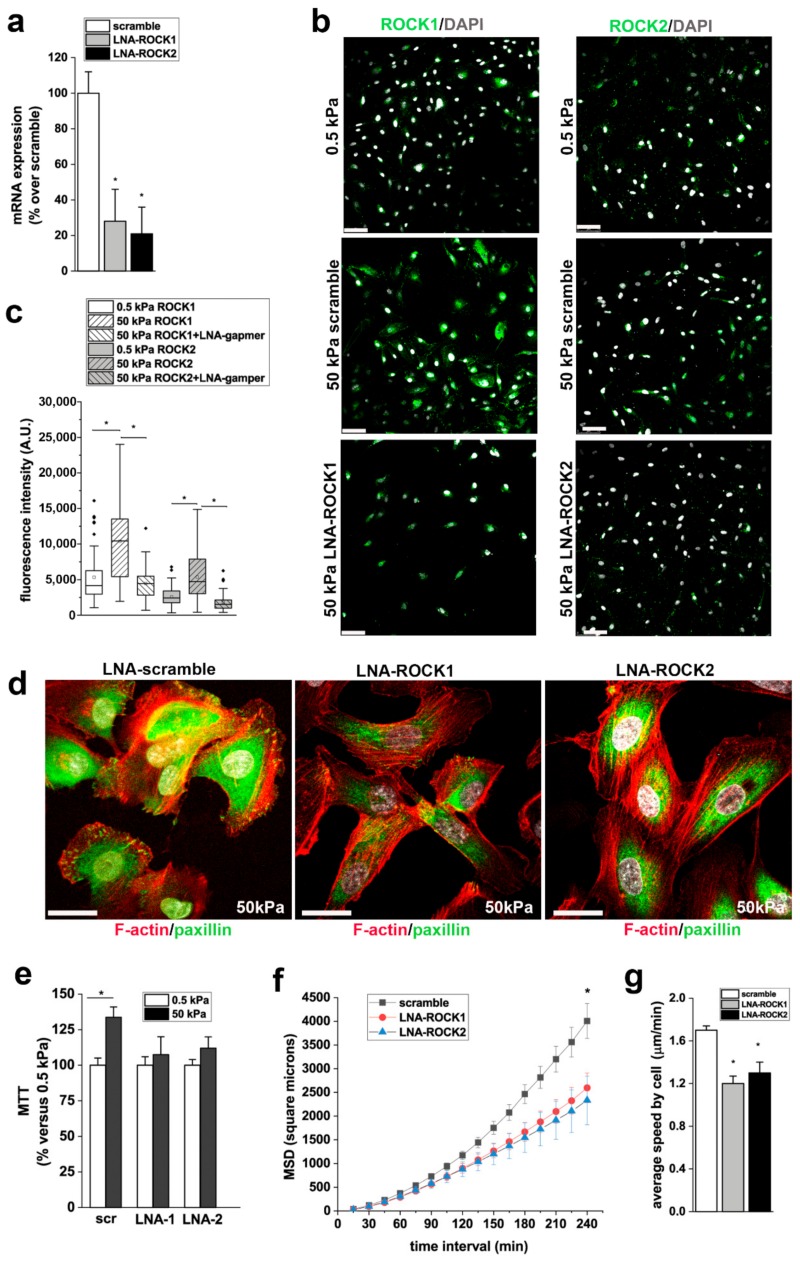
Figure 7.
ROCK 1 and ROCK2 mediate the effects of stiffness on RPC proliferation and migration. (a) ROCK1 and ROCK2 mRNA expression in scramble and LNA-GapmeRs treated RPCs, as assessed by RT-PCR (n = 2 experiments). (b) ROCK1 (top) and ROCK2 (bottom) expression (green) in RPCs cultured on 0.5 kPa substrate (left) and on 50 kPa substrates 48 h after transfection with scramble and ROCK1 and ROCK2 LNA-GapmeRs. DAPI counterstains nuclei (white). Bars = 75 μm. (c) Quantification of ROCK1 and ROCK2 fluorescence intensity in RPCs cultured on substrate with 0.5 kPa stiffness and in RPCs cultured on 50 kPa substrates 48 h after transfection with scramble and ROCK1 and ROCK2 LNA-GapmeRs. At least 50 cells for each condition were analyzed. Box-and-whisker plots: line = median, box = 25–75%, whiskers = 10–90%. (d) Confocal images of F-actin immunodetection by phalloidin (red), paxillin (green) and nuclei with DAPI counterstain (white) in RPCs cultured on 50 kPa substrate treated with scramble and with ROCK1 and ROCK2 LNA-GapmeRs. Bars = 25 μm. (e) Percentage of cell viability in scramble and LNA-ROCK1 and ROCK2 treated RPCs cultured on 50 kPa substrate versus RPCs grown on 0.5 kPa substrate. Data are mean ± SE (replicate n = 4). (f) MSD of RPCs treated with scramble or LNA-GapmeR for ROCK1 and ROCK2 and cultured on 50 kPa stiffness (n = 45, 30, and 32 trajectories for 50 kPa + scramble, 50 kPa + LNA-ROCK1, and LNA-ROCK2, respectively). (g) Average speed of RPCs transfected with scramble or LNA-GapmeR for ROCK1 and ROCK2 and cultured on 50 kPa. At least thirty randomly selected RPCs were monitored over 3 h for each condition. Data are expressed as mean ± SE. *p < 0.05 using one-way ANOVA followed by Tukey’s or Bonferroni post-hoc test, as appropriate.

