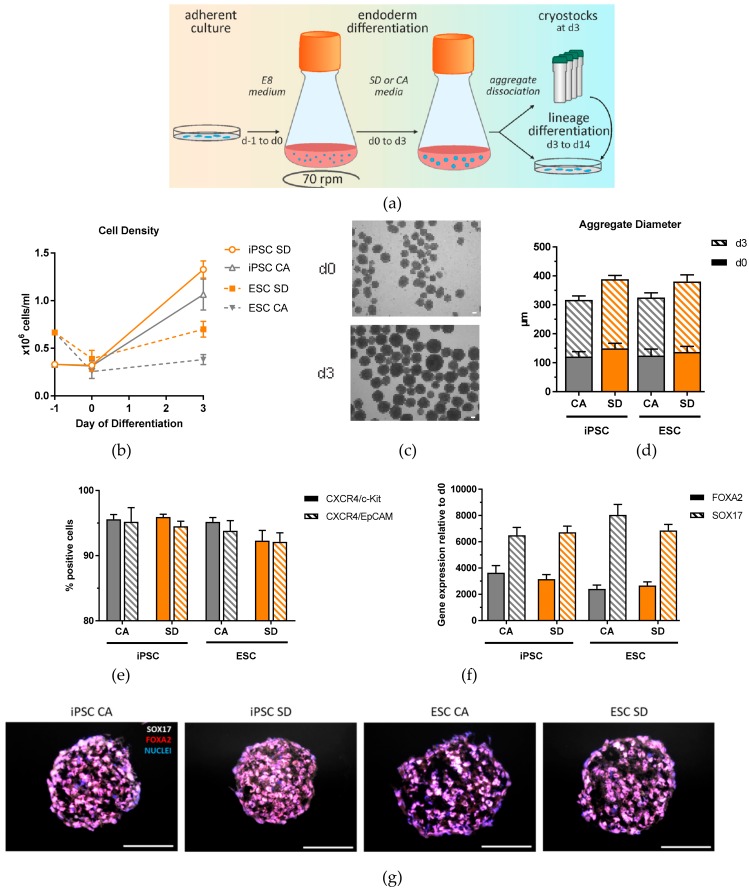
Figure 1.
Generation and characterization of DE aggregates in Erlenmeyer flasks. (a) Schematic overview of definitive endoderm differentiation in suspension. (b) Cell density analyzed at day 0 and day 3 of differentiation (n = 4–6). (c) Representative brightfield image of iPSC aggregates at day 0 and day 3 of differentiation (n = 4–6). (d) Aggregate diameters measured at day 0 and day 3 of differentiation. (e) Definitive endoderm efficiency quantification based on flow cytometry analysis of CXCR4/c-Kit and CXCR4/EpCAM double positive cells at day 3 of differentiation (n = 12–15). (f) qRT-PCR analysis of FOXA2 and SOX17 expression at day 3 of differentiation (n = 6–9). (g) Immunostaining of SOX17 (white) and FOXA2 (red), and nuclear stain DAPI (blue) of DE aggregates at day 3 of differentiation (n = 3). Scale bar, 100 μm. Each value of gene expression was first normalized to the reference genes and then to day 0 undifferentiated cells. Values are represented as the mean ± SEM. All n values correspond to independent experiments.

