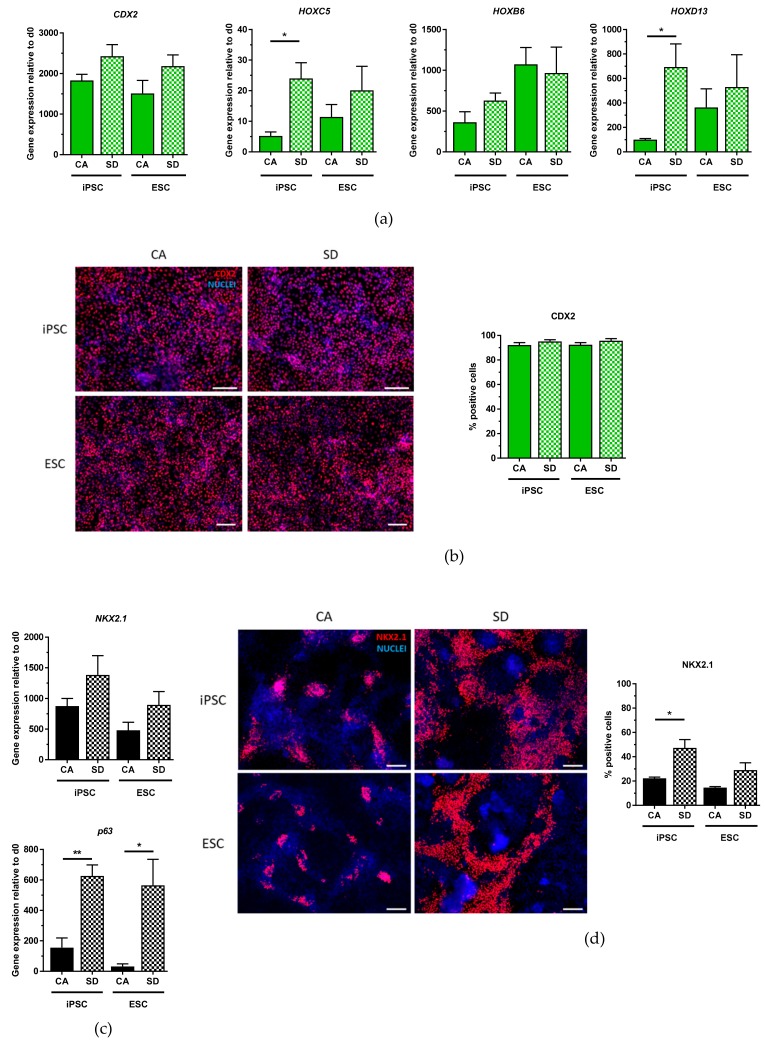
Figure 3.
Intestinal and lung progenitor differentiation potential of DE aggregates is confirmed by gene expression analysis and immunofluorescent staining. (a) qRT-PCR analysis of CDX2, HOXC5, HOXB6, HOXD13 expression at day 7 of intestinal differentiation (n = 3–4). (b) Immunostaining of CDX2 (red) nuclear stain DAPI (blue), and quantification of CDX2+ cells at day 7 of intestinal differentiation (n = 3–4). (c) qRT-PCR analysis of NKX2.1 and p63 expression between days 10–12 of lung differentiation (n = 3–4). (d) Immunostaining of NKX2.1 (red), nuclear stain DAPI (blue), and quantification of NKX2.1+ cells between days 10–12 of lung differentiation (n = 3). Scale bar, 100 μm. Each value of gene expression was first normalized to the reference gene(s) and then to day 0 undifferentiated cells Values are represented as the mean ± SEM. * p < 0.05. ** p < 0.01. All n values correspond to independent experiments.

