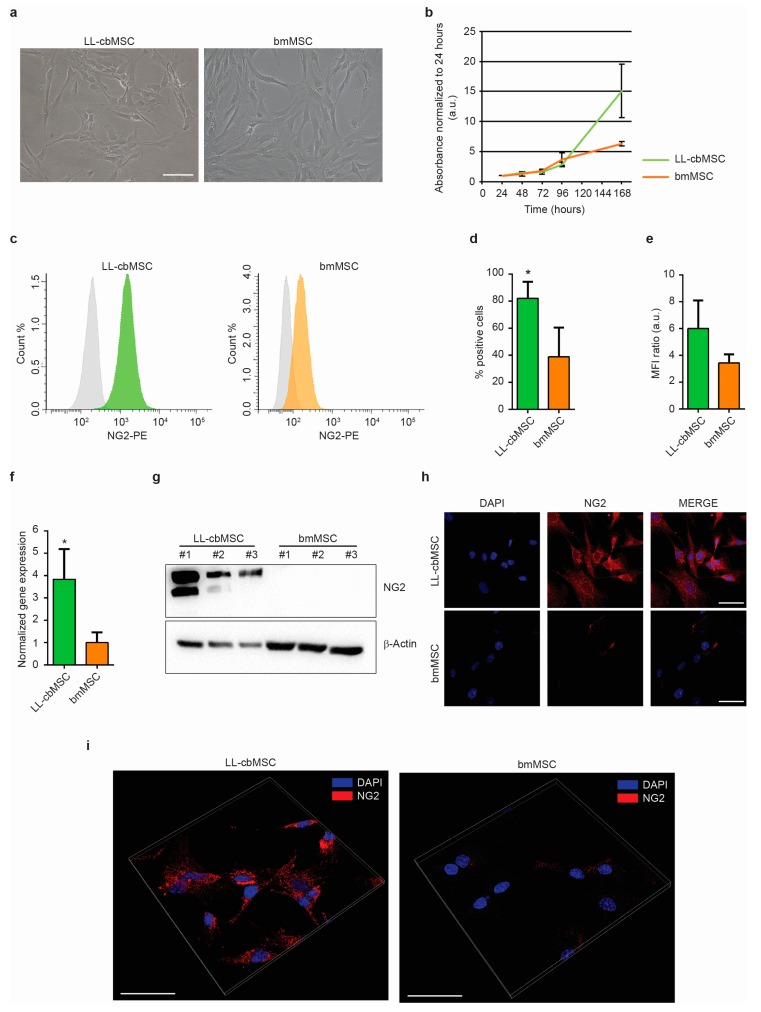
Figure 1.
(a) Representative bright-field images of LL-cbMSC and bmMSC. Scale bar is 100 µm for both images. (b) Growth curve of LL-cbMSC and bmMSC. Mean and standard deviation are represented; n = 3 each experimental group; a.u., arbitrary units. (c) Representative flow cytometry histograms showing isotype (grey) and LL-cbMSC (green) or bmMSC (orange) NG2-PE fluorescent signal. (d) Histograms showing the percentage of NG2+ events measured by flow cytometry. Mean and standard deviation are represented; * p < 0.05; statistical analysis is two-tailed unpaired Student’s t-test, n = 3 each experimental group. (e) Histograms showing mean fluorescence intensity (MFI) ratios measured by flow cytometry. Mean and standard deviation are represented; n = 3 each experimental group. (f) Histograms showing NG2 gene expression measured by qPCR. Mean and standard deviation are represented; * p < 0.05; statistical analysis is two-tailed unpaired Student’s t-test, n = 3 each experimental group. (g) Upper panel: Western blot showing expression of the protein of interest. Lower panel: Western blot showing expression of a house-keeping protein. (h) Representative confocal microscopy images of NG2 expression compared to nuclei signal (DAPI). Scale bar is 50 µm for all images. (i) Representative confocal microscopy three-dimensional projections of NG2 protein localization compared to nuclei signal (DAPI). Scale bar is 50 µm for all images.

