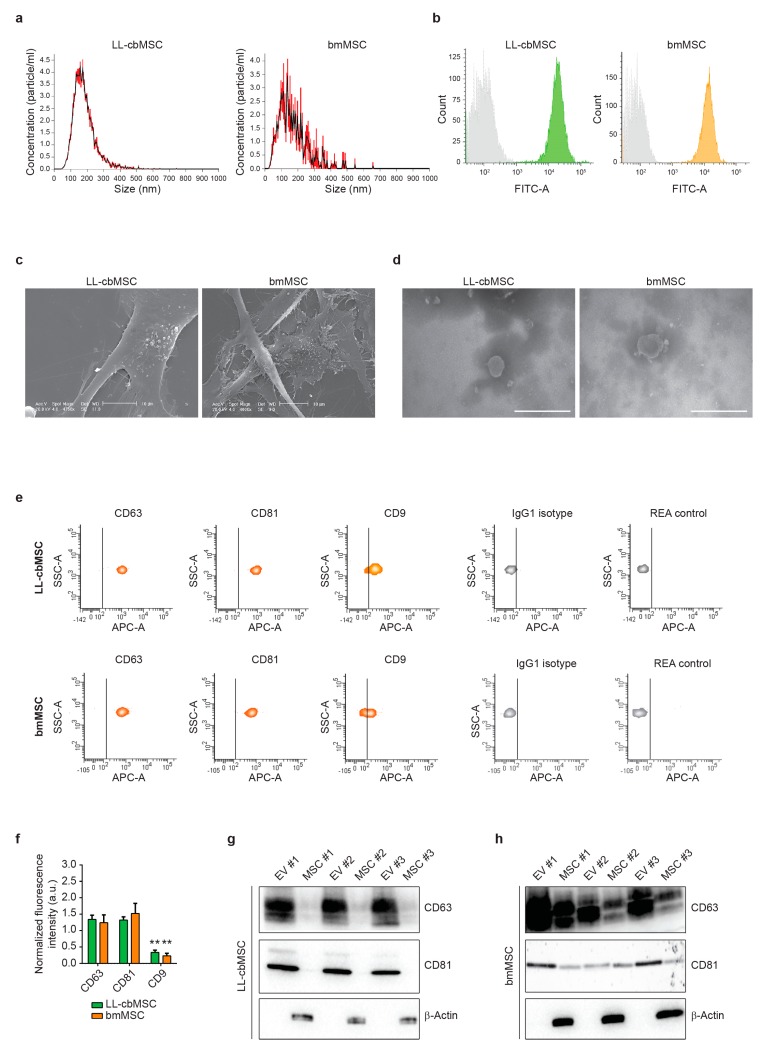
Figure 2.
(a) Representative histograms of particle size distribution by nanoparticle tracking analysis. Mean and standard deviation of n = 5 repeated measures are represented. (b) Representative flow cytometry histograms showing isotype (grey) and LL-cbMSC (green) or bmMSC (orange) CFSE fluorescent signals. (c) Representative scanning electron microscopy images of extracellular vesicle (EV) budding by MSC. Scale bar is 10 µm for all images. (d) Representative transmission electron microscopy images of isolated EV. Scale bar is 500 µm for all images. (e) Representative flow cytometry density plots showing fluorescent signal as detected by APC-A channel for different antigens and controls; IgG1 isotype is CD63 and CD9 control; REA control is CD81 control. The vertical bar marks positivity for APC-A signal. (f) Histograms showing APC-A signal normalized to the average of mean fluorescence intensity of CD63, CD81, and CD9. Mean and standard deviation are represented, n = 3 for each experimental group; a.u., arbitrary units. (g,h) Western blots showing expression of the proteins of interest in EV and the respective parental cells for LL-cbMSC (g) and bmMSC (h).

