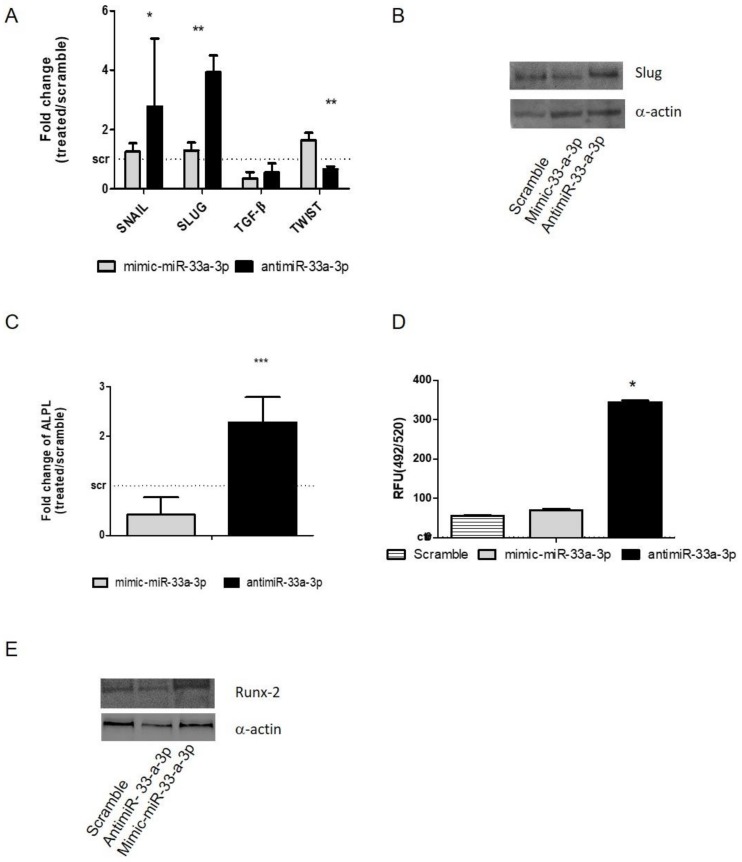
Figure 3.
Study of miR-33a-3p-targets by gain and loss of function assays; hMSCs after 24 h of transfection with specific mimic and antimiR were analyzed for the gene expression modulation by qRT-PCR and protein Western blot analysis. (A) EMT markers: SNAIL, SLUG, TWIST, TGF-β; (B) Slug; (C) ALPL. OsteoImage assay was performed to quantify the quantitative in vitro mineralization nodules, and data are shown as RFU (492/520 nm) (D) Western blot analysis for Runx-2 (E) protein was performed on total cell extract after miR-33a-5p and 3p over-expression or inhibition. Quantitative RT-PCR data are expressed as fold of change (FOI) in gene expression (2−ΔΔCt) that occurred in mimic or antimiR vs. scramble groups. Student t test: * p < 0.05, ** p < 0.005, *** p < 0.0005 between experimental group.

