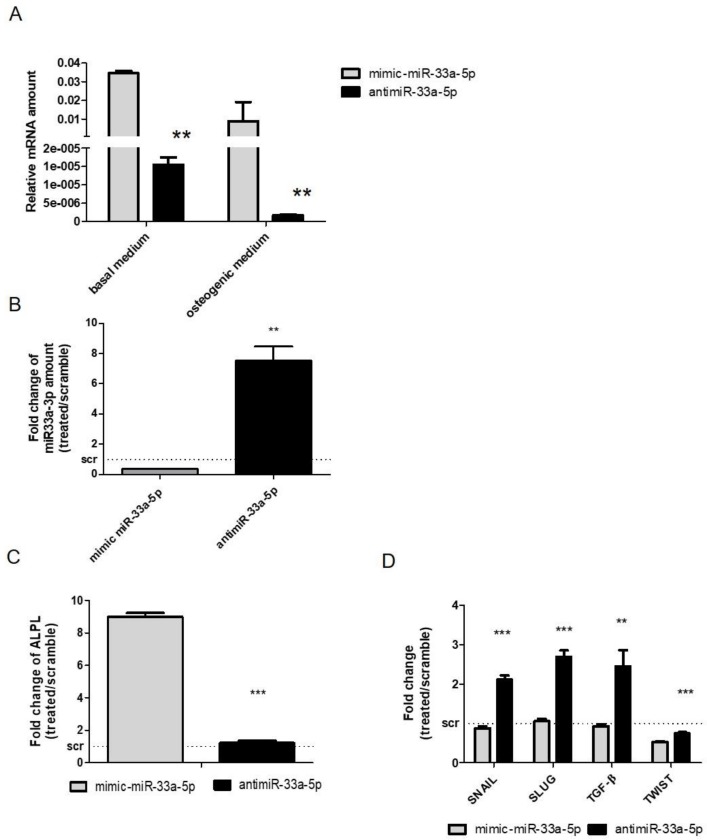
Figure 4.
Evaluation of miR-33a-5p over-expression or inhibition on hMSCs maintained in Osteogenic Differentiation Medium (OM) for 3 days. qRT-PCR analysis was performed for: (A) miR-33a-5p; (B) miR-33a-3p; (C) ALPL; (D) SNAIL, SLUG, TWIST, TGF-β. Quantitative RT-PCR data are expressed as relative miRNAs amount or as fold of change (FOI) in gene expression (2−ΔΔCt) that occurred in mimic or antimiR vs. scramble groups. Student t test: * p < 0.05, ** p < 0.005, *** p < 0.0005 between experimental group.

