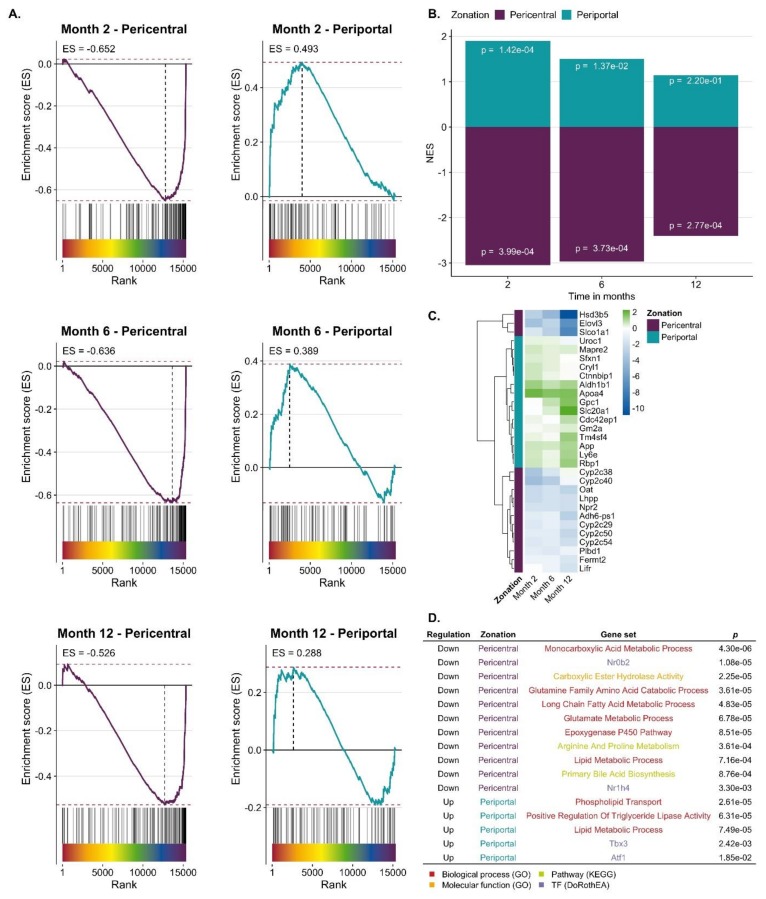
Figure 3.
Periportalization of CCl4 exposed liver tissue. A. Enrichment of pericentral and periportal genes among genes up or downregulated by CCl4 exposure. B. Summarized results of Gene Set Enrichment Analysis (GSEA) showing normalized enrichment score (NES) and p-values. C. Leading edge of periportal and pericentral gene set that mainly accounts for the enrichment score of the gene set. The color scheme indicates the logFC. D. Selection of GO-terms and TFs that characterize the overlap of CCl4 signature and pericentral/periportal gene sets.

