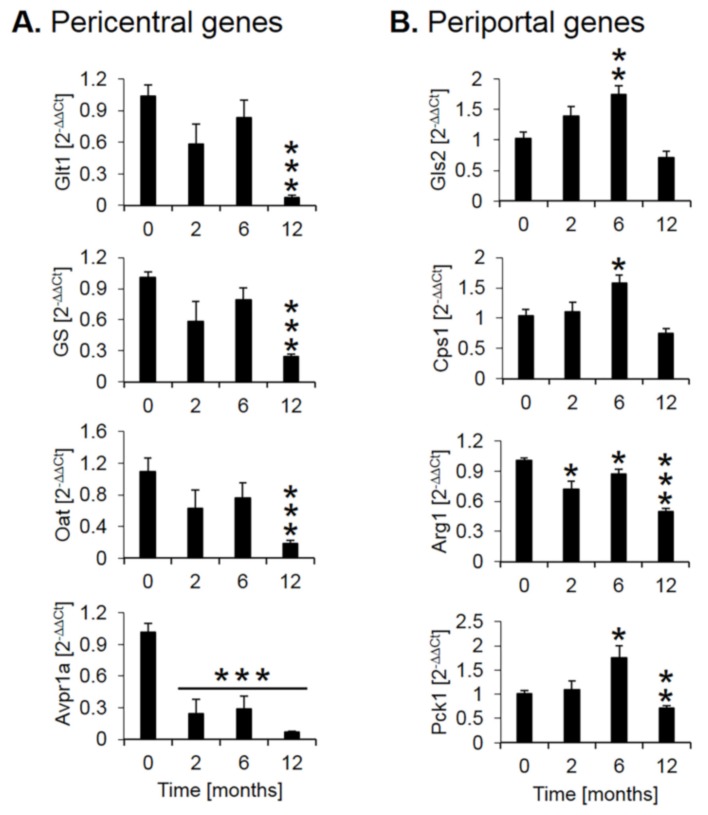
Figure 4.
Quantitative real-time polymerase chain reaction (qRT-PCR) confirmation of selected pericentral (A) and (B) periportal genes. The x-axis represents the time of CCl4 treatment, while the y-axis depicts relative RNA expression normalized to controls (0 months). Glt1: glutamate transporter 1; GS: glutamine synthetase; Oat: ornithine aminotransferase; Avpr1a: arginine vasopressin receptor 1A; Gls2: glutaminase 2; Cps1: carbamoyl phosphate synthetase I; Arg1: arginase 1; Pck1: phosphoenolpyruvate carboxykinase 1. The data are means ± standard errors of 6 mice per time point. * p < 0.05; ** p < 0.01; *** p <0.001 compared to the untreated controls (0).

