Figure 7.
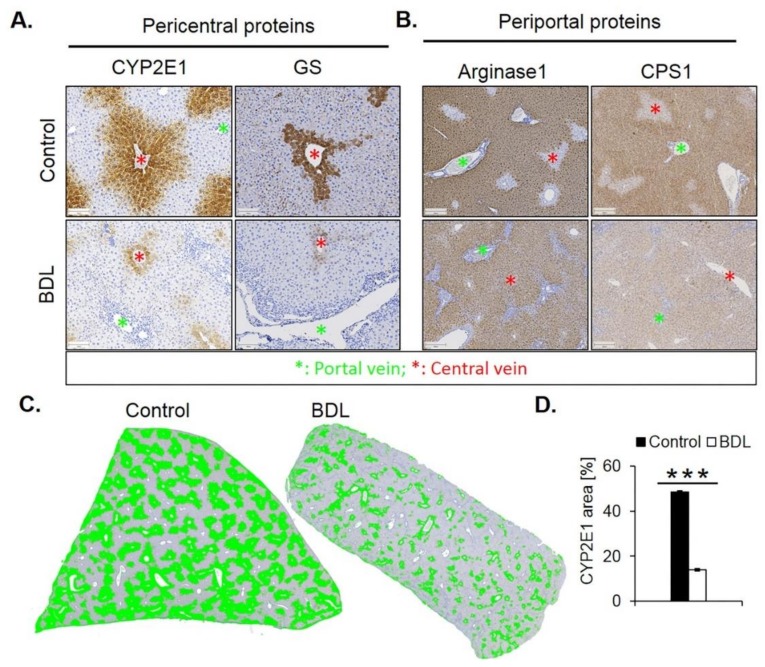
Periportalization of lobular zonation after BDL. (A) Immunostaining of the pericentral proteins CYP2E1 and GS. Scale bars: 100 µm. (B) Immunostaining of the periportal proteins arginase1 and CPS1. Scale bars: 200 µm. (C) CYP2E1-immunostained whole slide scans of liver lobules of BDL mice, and segmentation of the positive area (green). (D) Quantification of the fraction of CYP2E1 positive tissue 21 days after BDL and in controls. The data are means ± standard errors of 3 mice per group. *** p < 0.001 compared to the sham controls (0).

