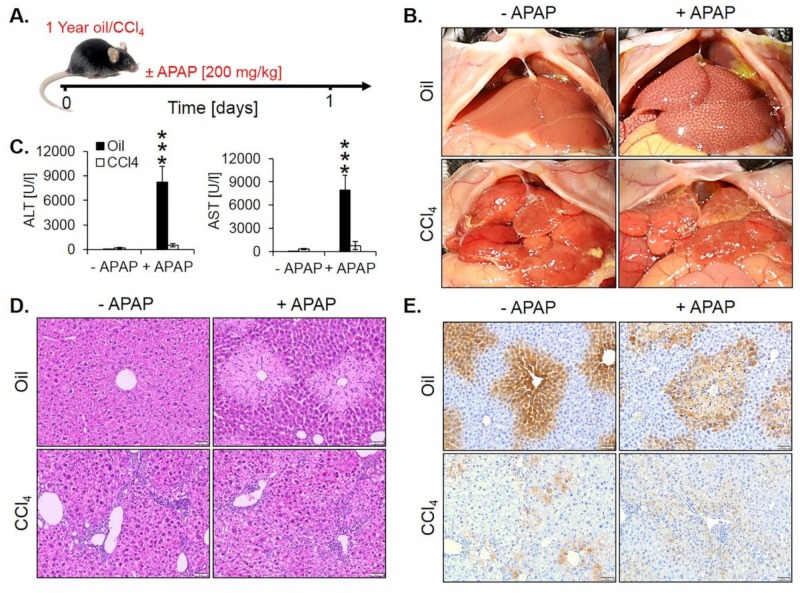
Figure 9.
Acetaminophen (APAP) resistance of mice after one year of treatment with CCl4. (A) Experimental schedule. (B) Macroscopic appearance. (C) The concentration of liver enzymes in the blood. The data are means ± standard errors of 5 mice per time point. *** p < 0.001 compared to the corresponding controls without APAP intoxication. (D) H&E-stained tissue. Scale bars: 100 µm. (E) CYP2E1 immunostaining. Scale bars: 100 µm.

