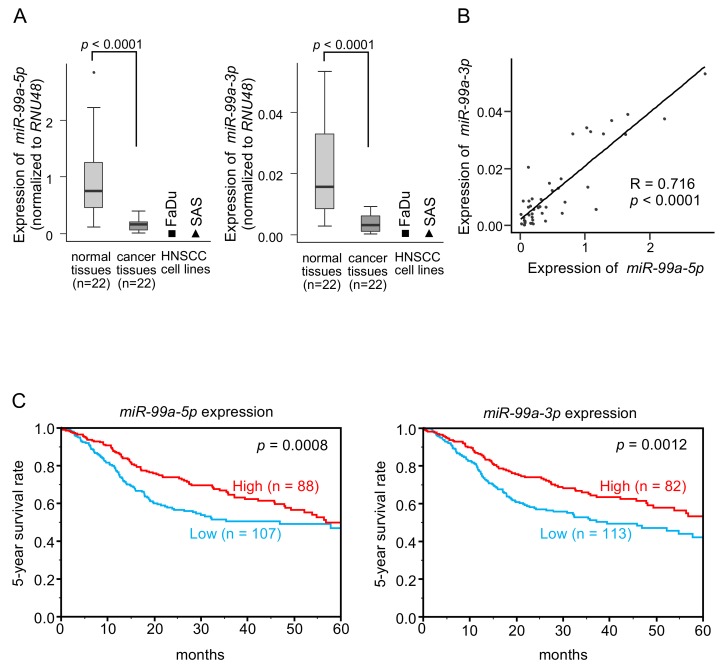
Figure 1.
Expression and clinical significance of miR-99a-5p and miR-99a-3p in HNSCC clinical specimens. (A) Expression of miR-99a-5p and miR-99a-3p was significantly reduced in HNSCC clinical specimens and cell lines (FaDu and SAS cells). Data were normalized to the expression of RNU48. (B) Spearman’s rank tests showed positive correlations between expression levels of miR-99a-5p and miR-99a-3p in clinical specimens. (C) Kaplan-Meier survival curve analyses of patients with HNSCC using data from The Cancer Genome Atlas (TCGA) database. Patients were divided into two groups according to miRNA expression, high group and low group (according to median expression). The red line shows the high expression group, and the blue line shows the low expression group.

