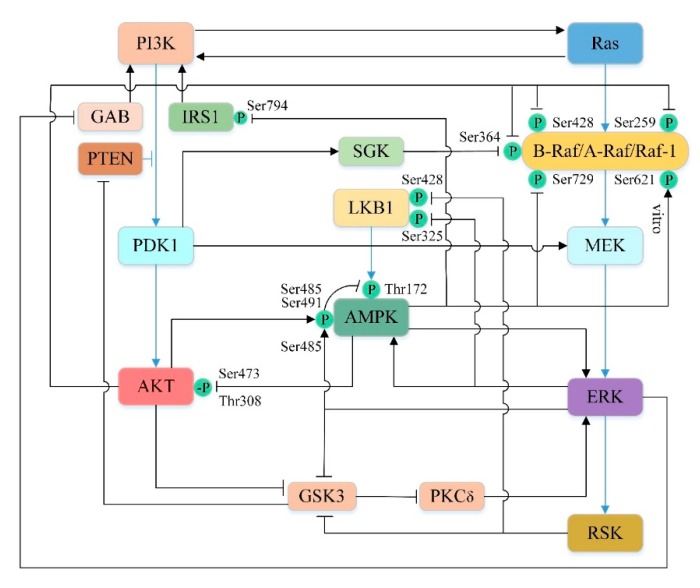
Figure 5.
Cross-talk between PI3K/AKT, AMPK and Ras/Raf/MEK/ERK pathway. Black lines indicate crosstalk between the three pathways, with arrows indicating promotion and blunt arrows indicating inhibition. The blue lines indicate the relationship of the three paths themselves. P represents phosphorylation, -P represents dephosphorylation. See text for details.

