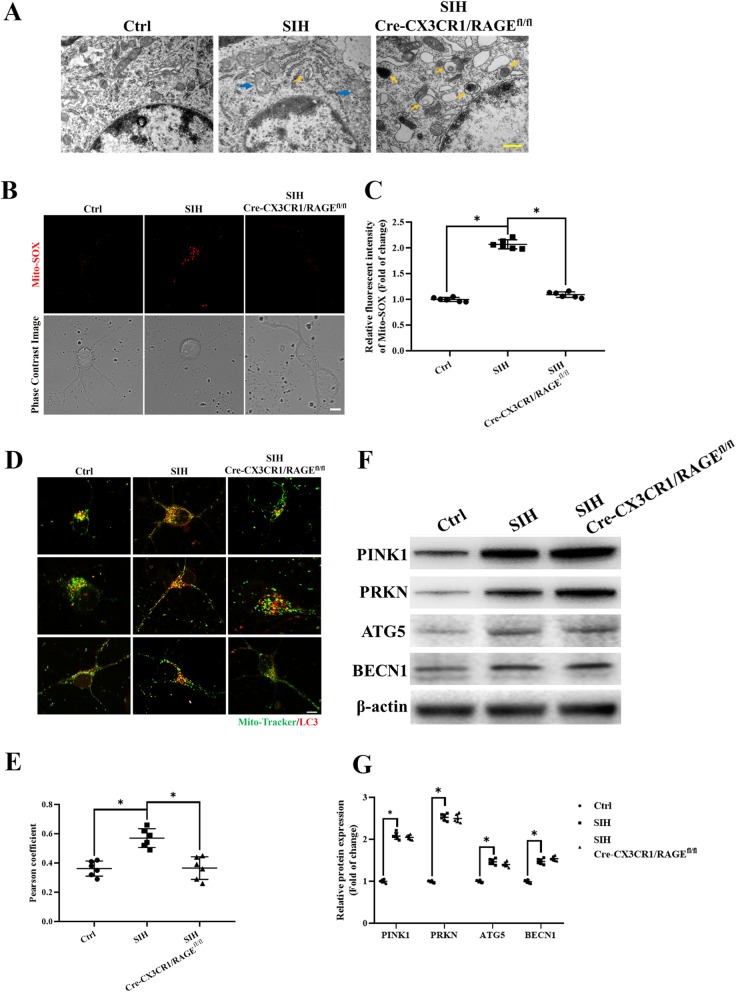
Fig. 5.
Mitophagy initiation in microglia was increased in the RVLM of stressed mice a Representative photomicrographs of microglia from mice preparation for visualization in transmission electron microscopy (60,000×). Blue arrows indicate disruption of the mitochondria with derangement of the mitochondrial crests. Yellow arrows indicate autophagosome. b, c Representative graph indicates fluorescent probe staining and intensity values of mitoROS; the bottom panel images show the corresponding phase-contrast images (scale bar = 1 μm). d Detection of mitochondria (MitoTracker Green) and LC3 (Red) colocalization using confocal microscopy (scale bar = 2 μm). e The levels of colocalization of LC-3 and MitoTracker were assessed using the Pearson coefficient. f, g Representative immunoblot band and densitometry quantitation of autophagy-related protein (PINK1, PRKN, BECN1, and ATG5) expression in microglia in different groups of mice were shown. Data are presented as mean ± SEM. n = 6, *P < 0.05, ANOVA LSD test

