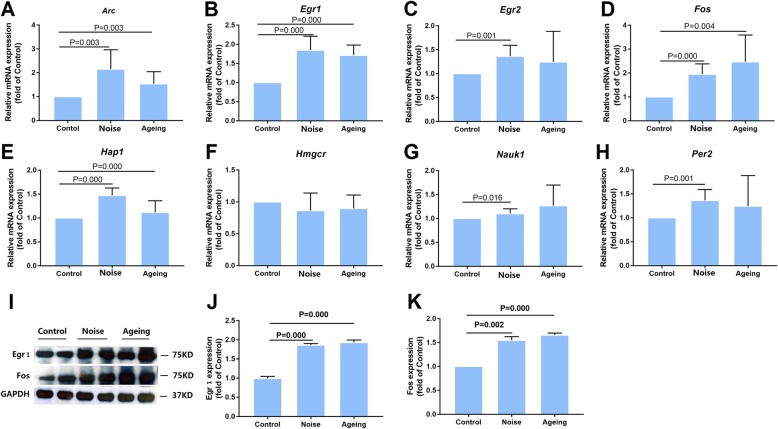
Fig. 3.
Validation and quantitative assessment of selected AD-related differential genes. a–h. Validation of transcript expression by qPCR. mRNA expression levels of differential genes in SAMP8 mouse brain samples; GAPDH was used as a loading control. i–k. Quantitative assessment of Egr1 and Fos levels in the hippocampus. The density of the immunoreactive bands was quantified and represented as a percent change relative to the control; GAPDH was used as a loading control. Data were expressed as mean ± standard deviation (n = 6 per group). Results were normalized with the control = 100%

