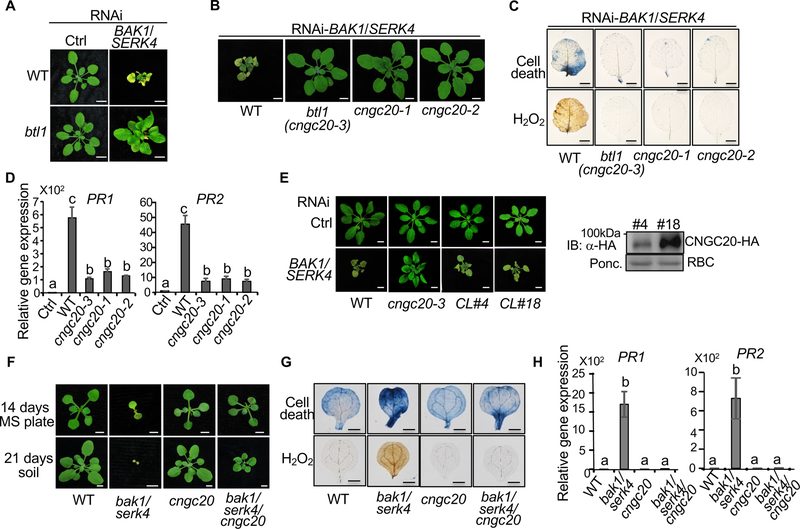
Figure 1. The cngc20 mutants suppress bak1/serk4 cell death.
(A) The btl1 mutant suppresses growth defects triggered by RNAi-BAK1/SERK4. Plant phenotypes are shown two weeks after VIGS of BAK1/SERK4 or a vector control (Ctrl). Bar=5 mm.
(B) The cngc20 mutants suppress growth defects triggered by RNAi-BAK1/SERK4. Plant phenotypes are shown for WT, btl1 (cngc20–3), cngc20–1, and cngc20–2 two weeks after VIGS of BAK1/SERK4. Bar=5 mm.
(C) The cngc20 mutants suppress cell death and H2O2 production triggered by RNAi-BAK1/SERK4. Plant true leaves after VIGS of BAK1/SERK4 were stained with trypan blue for cell death (top panel) and DAB for H2O2 accumulation (bottom panel). Bar=2 mm.
(D) The cngc20 mutants suppress PR1 and PR2 expression triggered by RNAi-BAK1/SERK4. The expression of PR1 and PR2 was normalized to the expression of UBQ10. The data are shown as mean ± SE from three independent repeats. The different letters denote statistically significant difference according to one-way ANOVA followed by Tukey test (p<0.05).
(E) Complementation of cngc20–3 with the CNGC20 genomic fragment (gCNGC20) under its native promoter restores growth defects by RNAi-BAK1/SERK4. CL#4 and CL#18 are two representative lines. Bar=5 mm. The HA epitope tagged CNGC20 proteins in transgenic plants were detected with an α-HA immunoblot (IB). Protein loading is shown by Ponceau S staining (Ponc.) for RuBisCo (RBC).
(F) The cngc20–3 mutant partially rescues the seedling lethality of bak1–4/serk4–1. Seedlings were grown on 1/2MS plate and photographed at 14 days post-germination (dpg) (top panel, Bar=2 mm.) or in soil and photographed at 21 dpg (bottom panel, Bar=5 mm). The bak1–4/serk4–1 mutant was photographed at 14 dpg and dead at 21 dpg.
(G) Alleviation of cell death and H2O2 accumulation in bak1–4/serk4–1/cngc20–3 compared to bak1–4/serk4–1. Bar=1 mm.
(H) Reduced PR1 and PR2 expression in bak1–4/serk4–1/cngc20–3 compared to bak1–4/serk4–1. The different letters denote statistically significant difference according to one-way ANOVA followed by Tukey test (p<0.05). The above experiments were repeated at least three times with similar results.

