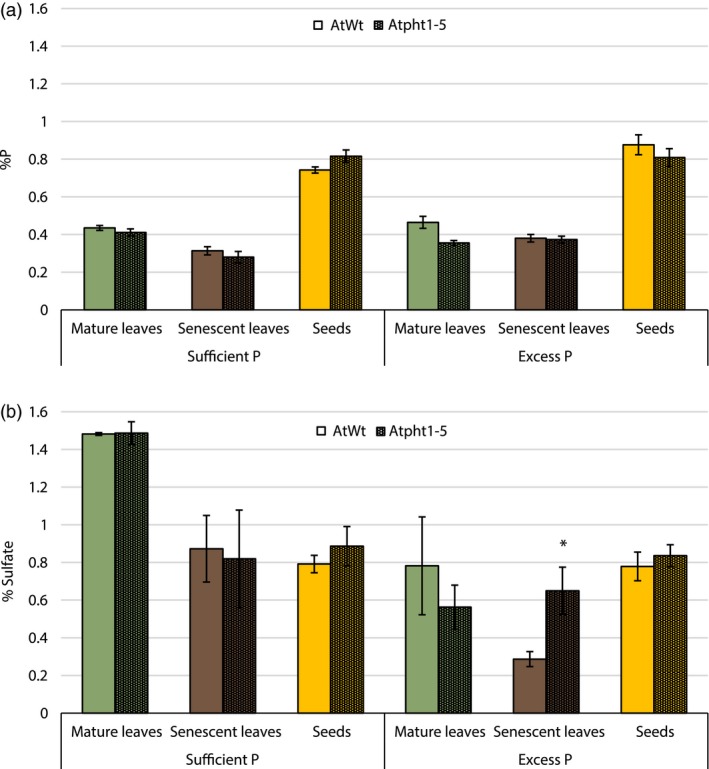
Figure 1.

All plants were given 0.1× MS devoid of phosphorus (sufficient P) (n = 3) or 0.1× MS with 20 times the usual phosphate concentrations (excess P) (n = 6). (a) Phosphorus concentrations (± SEM) as calculated from phosphate and phytic acid in various tissues of wild‐type and Atpht1‐5 Arabidopsis thaliana plants. (b) Sulphate concentrations (± SEM) found in various tissues of wild‐type and Atpht1‐5 A. thaliana plants
