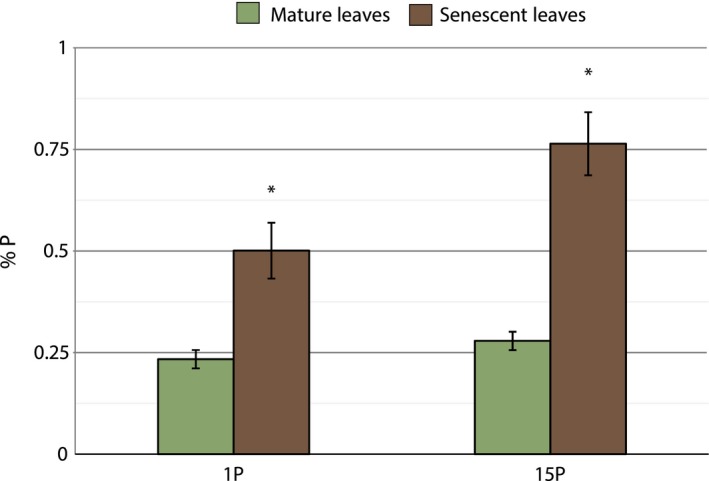
Figure 2.

Mean phosphorus concentration (± SEM), as calculated from inorganic phosphate, in hybrid poplar leaf tissue when exposed to two levels of external phosphorus, before (left) and after (right) senescence (n = 4). 1P trees were treated with optimal levels of phosphorus, and 15P trees were treated with excess phosphorus 15× above optimal levels. Asterisks (*) indicate P < 0.05
