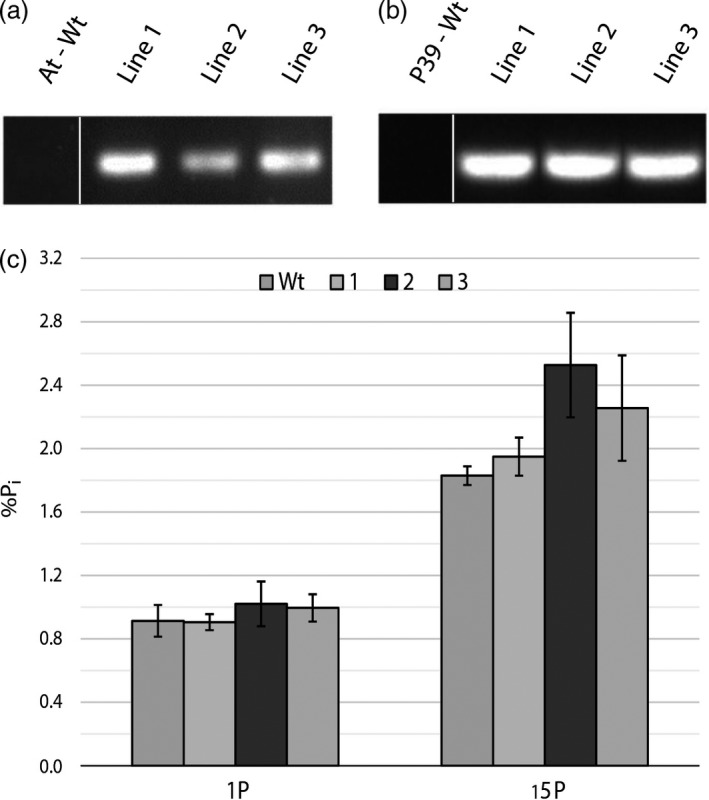
Figure 4.

Semi‐quantitative PCR bands showing expression of StPht1‐1 in the root tissue of three Arabidopsis thaliana transgenic lines (a), and three P39 transgenic lines (b). Each band represents a pooled sample of three biological replicates. The associated phosphate concentrations found in hybrid poplar root tissue (n = 4) at optimal (1P) and excess (15P) levels of external phosphorus (c)
