
Figure 6.
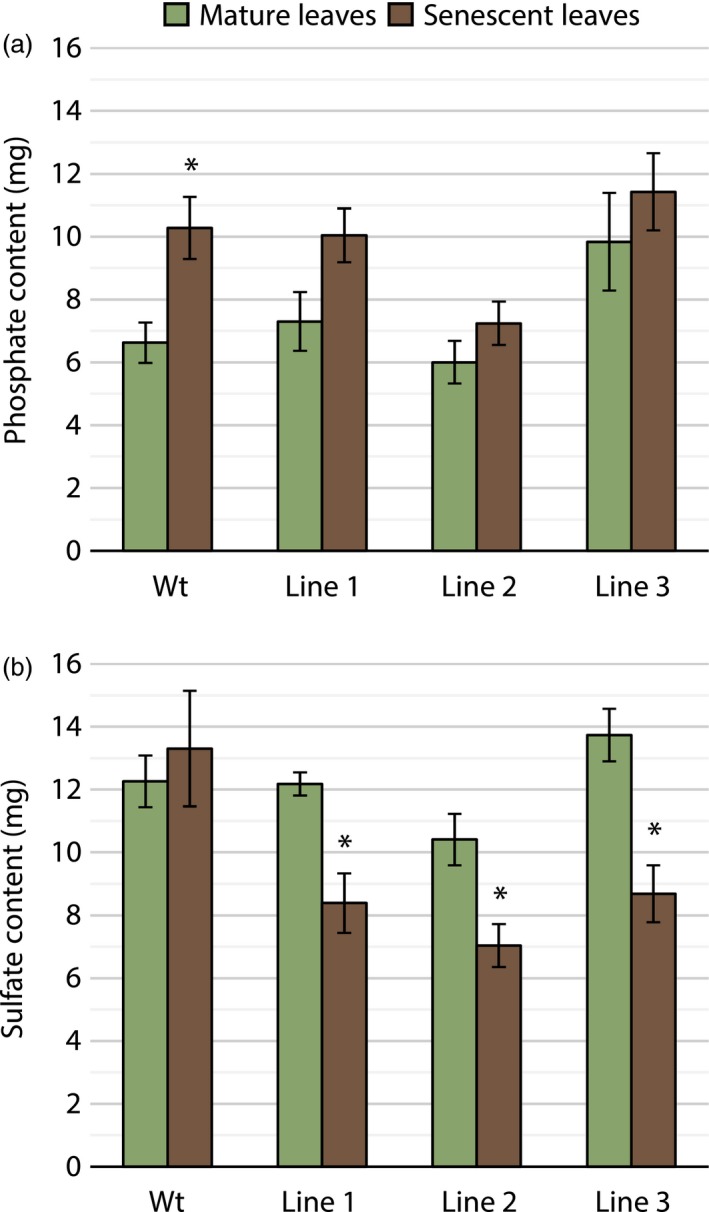
A comparison of phosphate and sulphate content in wild‐type hybrid poplar and each of the three transgenic poplar lines. (a) Mean phosphate content (± SEM) of mature leaves and senescent leaves at the control treatment (100N:13P; n = 4). (b) Mean sulphate content (± SEM) of mature leaves and senescent leaves. Phosphate treatments did not affect sulphate content resulting in the pooling of biological replicates across treatments (n = 10). Asterisks (*) indicate P < 0.05