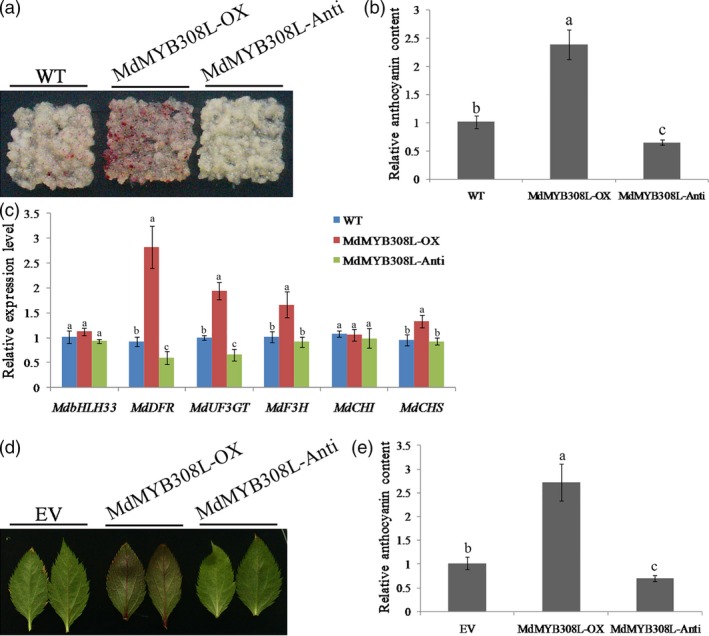
Figure 3.

Anthocyanin accumulation in MdMYB308L transgenic apple calli and leaves. (a) Appearance of apple calli of 15‐day‐olds after highlight treatment for 7 days. WT: wild‐type; MdMYB308L‐OX: MdMYB308L‐overexpression; MdMYB308L‐Anti: MdMYB308L antisense suppression. (b) The relative anthocyanin contents of apple calli shown in (a). The value for WT was set to 1. (c) Relative expression levels of anthocyanin biosynthesis‐related genes in apple calli shown in (a). Quantitative real‐time PCR analysis was performed in three biological replicates and three technical replicates. The value for WT was set to 1. (d) Appearance of apple leaves treated with highlight for 5 days. EV: empty vector; MdMYB308L‐OX: MdMYB308L‐overexpression; MdMYB308L‐Anti: MdMYB308L antisense suppression. (e) Relative anthocyanin contents of apple leaves shown in (d). The value for EV was set to 1. Each experiment was performed in three replicates. Error bars denoted standard deviation. Different letters above the bars indicated significant difference (P < 0.05) as obtained by one‐way ANOVA and LSD test.
