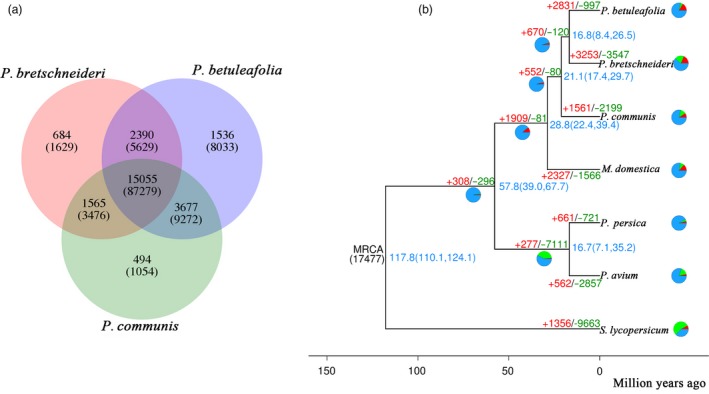
Figure 2.

Gene family evolution analysis. (A) Venn diagram showing the shared and unique gene families among three pear species. Each number in parentheses represents the number of genes within corresponding families (without parentheses). (B) Expansion and contraction of gene families in six Rosaceae species and tomato. A phylogenetic tree was constructed based on all single‐copy orthologous genes using tomato (Solanum lycopersicum) as the outgroup. Pie diagrams on each branch of the tree represent the proportion of genes undergoing gain (red) or loss (green) events. The numerical value beside each node shows the estimated divergent time.
