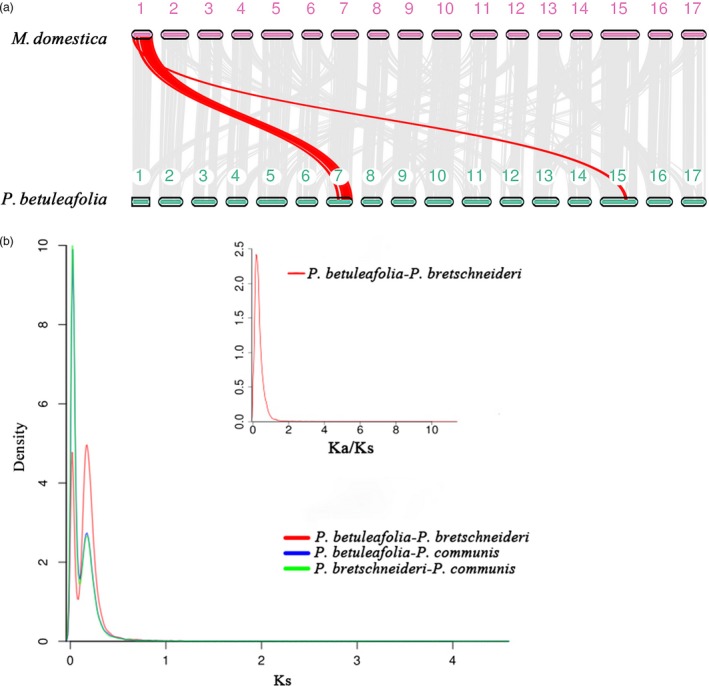
Figure 3.

Comparative analysis and evolution events in the Pbe‐ SD genome. (A) Syntenic blocks shared between the Pbe‐ SD and GDDH13 genomes. Grey lines connect matched gene pairs, with one set highlighted in red. (B) Ks distribution for paralogous and orthologous genes in comparisons of the Pbe‐ SD, DSHS and Bartlett genomes and Ka/Ks distribution in comparisons of the Pbe‐ SD and DSHS genomes.
