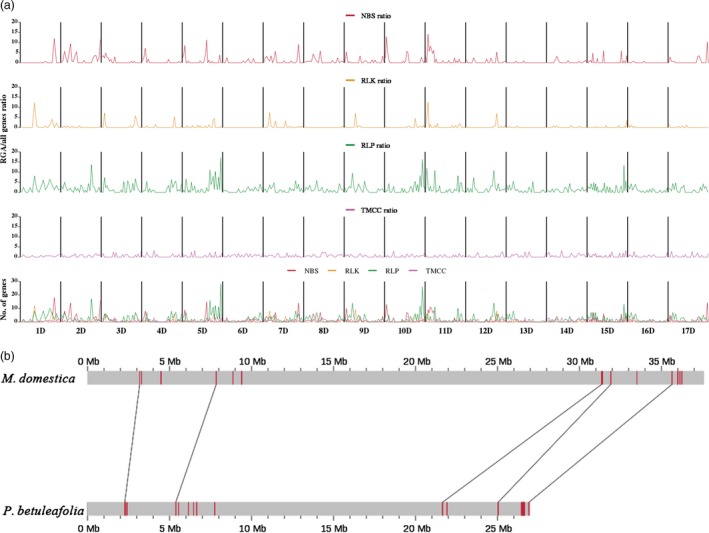
Figure 4.

Distribution of RGAs in chromosomes. (A) Distribution of RGAs along the Pbe‐ SD chromosomes. The bottom graph shows the absolute number of genes homologous to nucleotide‐binding site–leucine‐rich repeat (NBS‐LRR‐encoding) proteins, receptor‐like protein kinases (RLKs), receptor‐like proteins (RLPs) and transmembrane coiled‐coil (TMCC) proteins along each of the 17 chromosomes. The top four graphs show the ratio of the number of genes in each RGA class to the total number of genes in a sliding window of 10 Mb wide. (B) Collinearity comparison of TNL‐type genes on chromosome 2 of the GDDH13 and Pbe‐ SD genomes.
