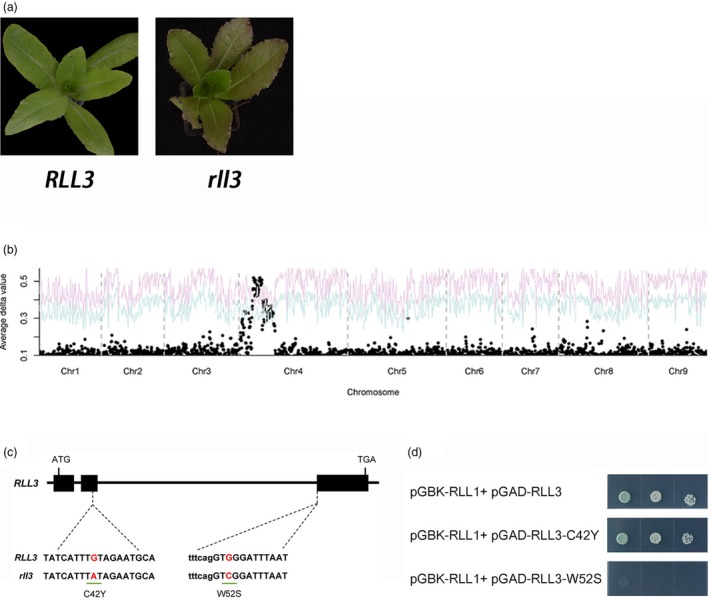
Figure 5.

Cloning of the RLL3 gene. (a) Leaf colour of RLL3 and rll3 in the segregating population. (b) Mapping of the RLL3 gene using BSA. The red and blue curves represent confidence probability of P = 0.01 and P = 0.05, respectively. (c) Gene structure of the RLL3 gene. The black boxes represent exons. The lines between the boxes represent introns. The two SNPs are shown. (d) Yeast two‐hybrid assays. These data indicate that RLL1 and RLL3 can interact and that the W52S substitution in RLL3 but not the C42Y substitution in RLL3 compromised these interactions.
