Figure 6.

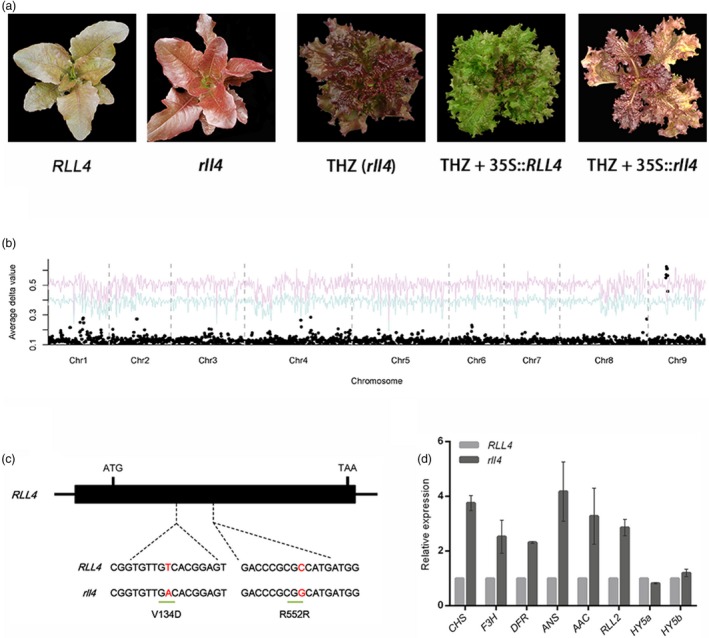
Cloning of the RLL4 gene. (a) Leaf colour of plants in the segregating population (left panel), red cultivar THZ (rll4) and transgenic plants with 35S::RLL4 and 35S::rll4 (right panel). (b) Mapping of the RLL4 gene using BSA. A NIL was used as the mapping population. The red and blue curves represent confidence probability of P = 0.01 and P = 0.05, respectively. (c) Structure of the RLL4 gene. The black boxes represent exons, and the lines between the boxes represent introns. The two SNPs are shown. (d) Expression of anthocyanin‐associated genes in the RLL4 and rll4 genotypes of NIL. Gene expression was quantified using qRT‐PCR. The expression of RLL2 and several genes required for anthocyanin biosynthesis was down‐regulated in RLL4 relative to rll4. RLL4 did not affect the expression of HY5a or HY5b. Data are means ± SEM (n = 3 biological replicates).
